
Figures & data
Figure 1. Spaghetti plots of the change of the log-transformed CD4 count data from the baseline separated by the two treatments. The blue line represents the mean of the observed outcomes at each visit point. The black lines refer to the individual outcome profiles.
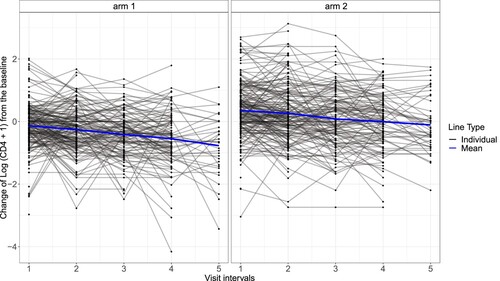
Figure 2. Normal QQ plots of the conditional residuals at each visit. The conditional residuals were obtained by fitting the sequential linear regressions on the current outcomes against the available history and calculating the residuals at each visit. The p-values for the Shapiro-Wilk test and the symmetry test are also provided.
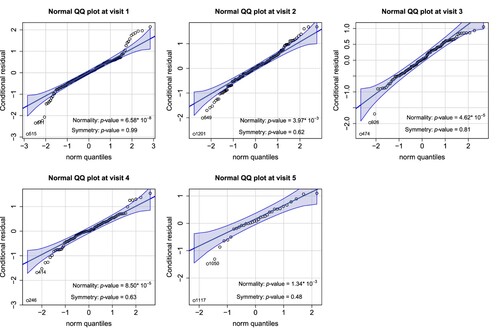
Table 1. The outcome mean model assumption specified by common CBI scenarios.
Table 2. Summary of the simulation methods and results.
Figure 3. Simulation results under different distributions based on 1000 MC simulations for the methods MI, MI Robust, LSE, and Robust. It visualizes the numerical results in Table and Tables S1–S3 in the supplementary material. The first row shows the type-1 error and power when the outcomes are normally distributed without outliers. The second row presents the results with the incorporation of the outliers in the simulated data. The third row illustrates the results under a heavy-tailed dataset.
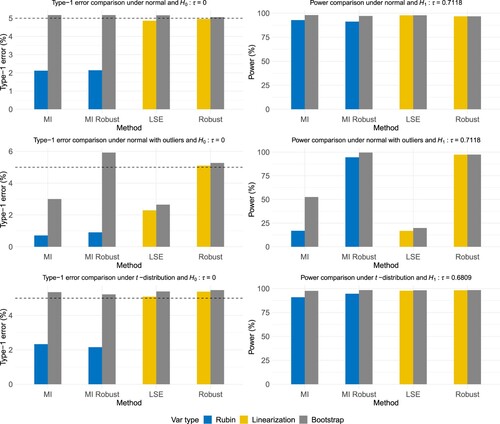
Table 3. Simulation results under the normal distribution without or with extreme outliers, where the true value and the missingness pattern is MNAR in the treated group.
Table 4. Analysis of the repeated CD4 count data under J2R.