Figures & data
Figure 1. Sugar contents of hydrolyzates after grape peel hydrolysis performed at 60 (a) and 120 (b) min. The different acid concentrations (in g l−1) and temperatures (in °C) are indicated. Each sample was treated in triplicates showing the mean value and the corresponding standard deviation
Table 1. Kinetic and stoichiometric parameters of cultivations of B. cereus using grape peel residues as sole carbon source
Figure 2. Shake flask cultivation of B. cereus using grape peel with (Δ) and without (□) hydrolysis pretreatment. Curves represent mean values from triplicates. Standard deviation is indicated
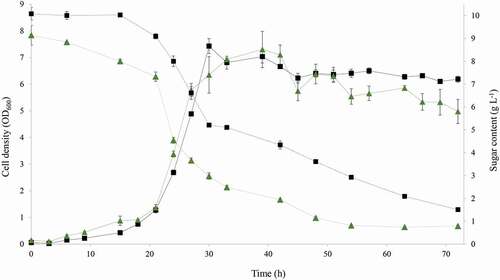
Table 2. PHB production parameters for cultivations of B. cereus using different extraction methods. Cultivation 1: non-hydrolyzed substrate; cultivation 2: hydrolyzed substrate; D: dry biomass; W: wet biomass
Figure 3. PHB accumulation (% w/w) in cultures of B. cereus growing with non-hydrolyzed substrate (cultivation 1) and hydrolyzed substrate (cultivation 2). Extractions were performed using dry (D) and wet (W) biomass
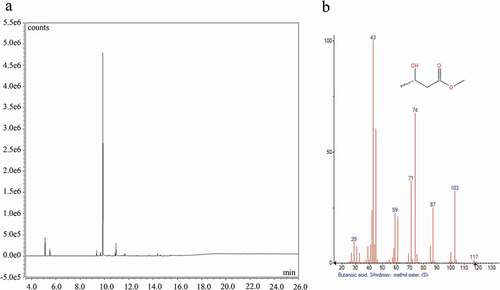
Figure 4. GC-MS analysis of extracted PHB from cultures of B. cereus growing on grape residues. A) Chromatogram in selected ion mode (SIM). B) Comparison of the peak (Rt: 9.87 min) with mass spectra MS library