Figures & data
Table 1. Properties of PBAT. Reproduced with permission from [Citation12]
Table 2. Commercial PBAT-based grades. The table lists the properties of 30 µm blown film: PE-LD, Ecoflex®, compounds of granular starch and Ecoflex®, compounds of thermoplastic starch and Ecoflex®. Reproduced with permission from [Citation29]. MD = machine direction, CD = cross direction
Table 3. The effect of rising content of thermoplastic starch (TPS) in the mixture with PBAT on mechanical properties of blends mixed in a twin screw extruder: σM – ultimate tensile strength, εb – elongation at break σy yield strength εy elongation at yield, E – Young’s modulus, SD – standard deviations. The PBAT was Ecoworld™ 003, and for the sample 50/50EF, Ecoflex™ (BASF) was used for comparison
Table 4. The effect of rising content of thermoplastic starch (TPS) in the mixture with PBAT on mechanical properties of blends mixed in an extruder and additional mixing in a laboratory mixer (Brabender) as an additional homogenizing step: σM – ultimate tensile strength, εB – elongation at break σy yield strength εy elongation at yield, E – Young’s modulus, SD – standard deviation. The PBAT was Ecoworld™ 003, and for the sample 50/50EF, Ecoflex™ (BASF) was used for comparison
Figure 1. Dependences of Young’s moduli values on temperature for varying ratios of PBAT/TPS. The weight portion of TPS in the mixture with PBAT is shown in the Figure
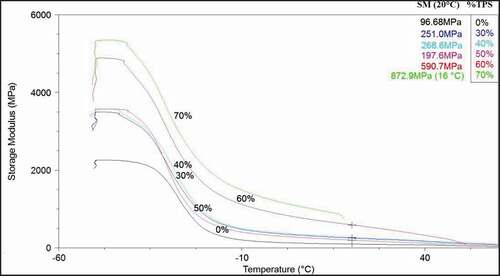
Figure 2. Dependences of tan delta values on temperature for varying ratios of PBAT/TPS. The weight portion of TPS in the mixture with PBAT is shown in the Figure
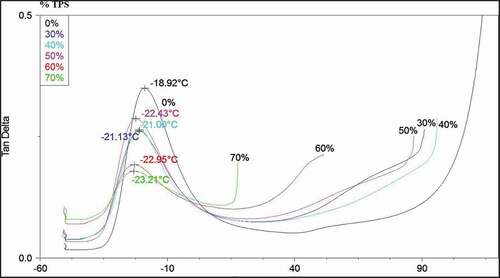
Figure 3. SEM images of fracture surfaces of mixtures of PBAT with thermoplastic starch (PBAT/TPS ratios in 70/30, 50/50 or 30/70 wt.%), prepared either by hammer hit after cooling the sample in liquid nitrogen (right column) or taken from parts of samples broken during tensile tests at room temperature (left column). The composition PBAT/TPS 50:50 is shown for samples either prepared from pellets (“unmixed”, after twin screw compounding) or after reprocessing in Brabender
Figure 3. (Continued)