
Figures & data
Figure 1. Number of PTAs since 1948 (Source: WTO)Footnote12
Figure 2. FTAs under article XXIV of GATT (year of entry in force) (Source: WTO).
Figure 3. FTAs under the enabling clause (year of entry in force) (Source: WTO).
Figure 4. EIAs under article V of GATS (Source: WTO).
Figure 5. Kaplan–Meier survival curves for FTAs under Article XXIV of GATT.
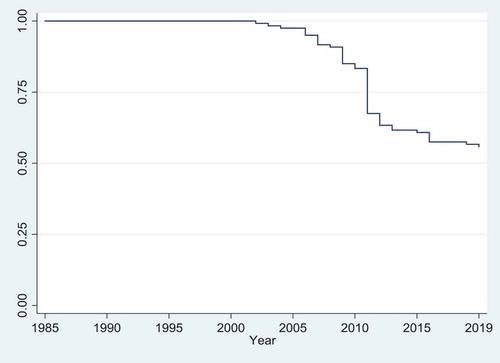
Figure 6. Kaplan–Meier survival curves for FTAs under the enabling clause.
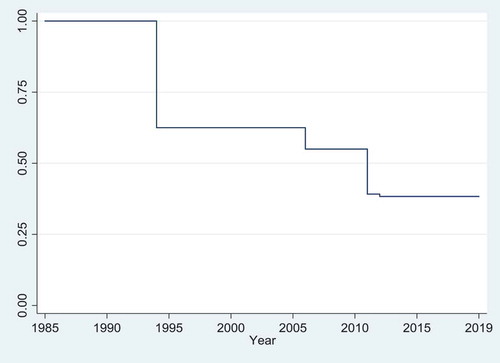
Figure 7. Kaplan–Meier curves for EIAs under Article V of GATS.
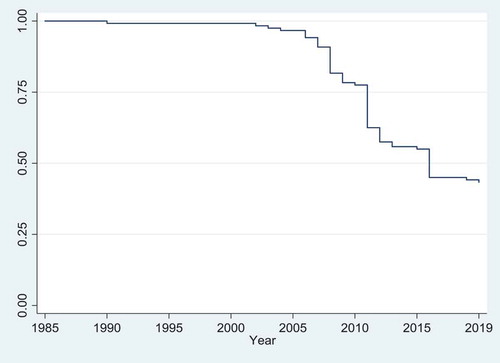
Table 1. Top trading partners for East Asian countries.
Table 2. Top FDI (stock of inward) partners for East Asian countries.
Table 3. Descriptive statistics for the variables.
Table 4. Statistical results of survival analysis (Cox proportional hazards model).
Table 5. Statistical results of Survival Analysis (Cox proportional hazards model).
Table 6. Statistical results of survival analysis (Cox proportional hazards model).