
Figures & data
Figure 1. Economic Indicators (GDP per capita, Yangzhou)
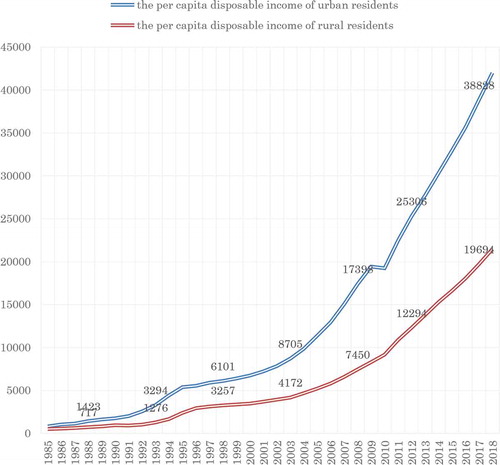
Figure 2. Economic Indicators (per capita disposable income, Yangzhou)
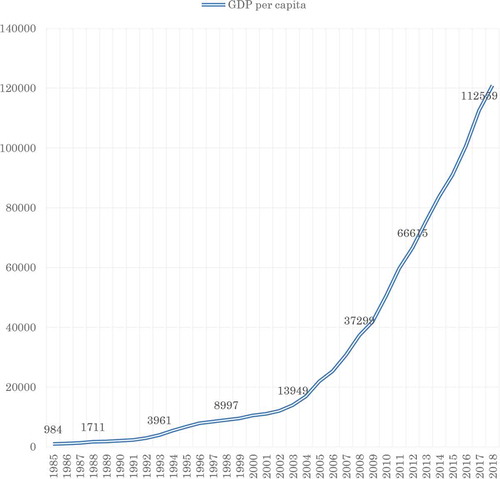
Table 1. Subregional GDP, Yangzhou (2018)
Table 2. The terms of Yangzhou MPC since 1998
Table 3. The shifts in delegate group size
Table 4. Bills and recommendations to the Yangzhou MPC (2001–2019)
Table 5. The age of the delegates
Table 6. Gender composition of the delegates, %
Table 7. The share of CCP members among the delegates, %
Table 8. Education level, % of the total no. of delegates
Table 9. The ranks of government officials
Table 10. The share of civil servant among the delegates of the Yangzhou MPC
Figure 3. The share of civil servant at the Yangzhou MPC (as a ratio of the total number of the delegates to Yangzhou MPC)
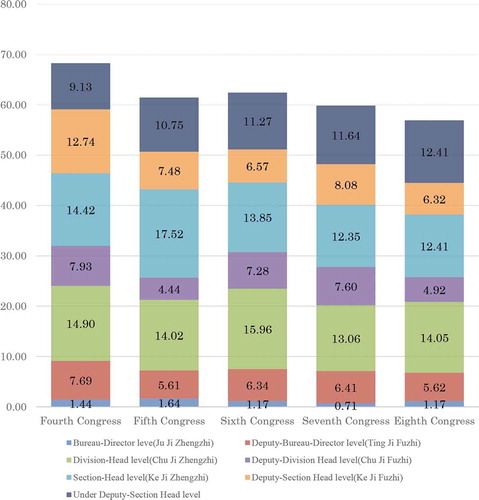
Figure 4. The share of high-level, middle-level, and lower-level civil servant at the Yangzhou MPC
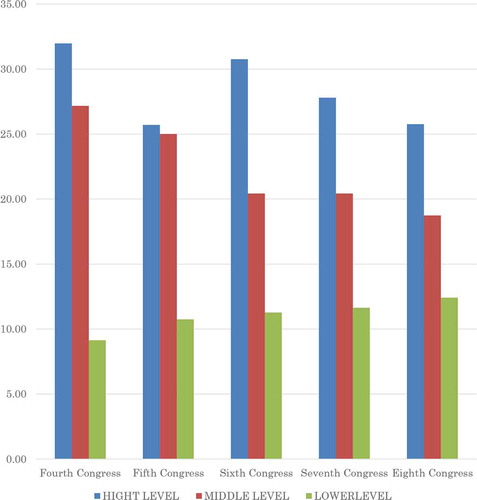
Figure 5. The share of civil servant, executive officer and others at the Yangzhou MPC
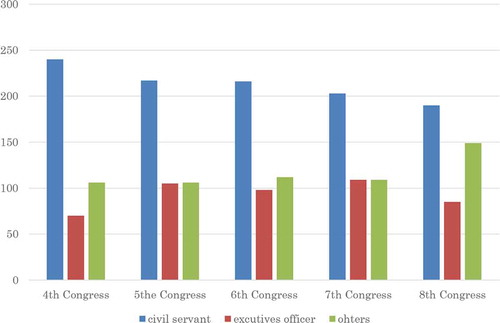
Table 11. The share of corporate executives and employees’ delegate at the Yangzhou MPC, %