Figures & data
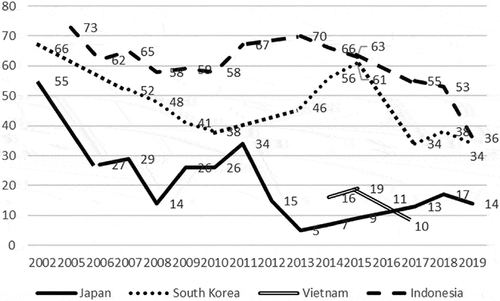
Figure 1. Favorable Views of China: 2002–2019 (%).

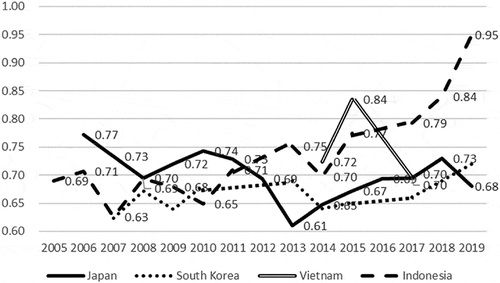
Figure 2. Standard Deviation in Views of China: 2005–2017.

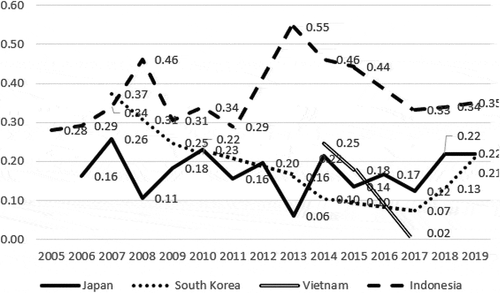
Figure 3. Correlation between Views of US and China: 2005–2017.

Table 1. Evaluation toward China’s Growing Economy
Table 2. Evaluation toward China’s Growing Military Power
Table 3. Asian Student Survey: Second to Third Wave
Table 4. Asian Views of China’s Influence: 2013–2019
Table 5. Chinese View of Asia’s Influence: 2013–2018
Table 6. Political Instability Frame: 2013–2019. “In spite of rapid economic growth, China is politically unstable.”
Table 7. Increasing Opportunity Frame: 2013–2019. “The rise of China offers us a lot of opportunities.”
Table 8. Global Threat Frame: 2013–2019. “The rise of China has been threatening the global order.”
Table 9. Peaceful Rise Frame: 2013–2019. “China will maintain her peaceful relations with Asian countries in spite of her rise.”
Table 10. Determinants of Evaluation of China’s Influence: Second Wave
Table 11. Determinants of Evaluation of China’s Influence: Third Wave
