Figures & data
Table 1. Usage of Mongolian livestock for subsistence use and MSU.
Table 2. Comparison of average area of pasture, number of livestock and livestock density.
Figure 1. Relationship between Mongolian natural environment, pastoralists’ food and livestock weight.
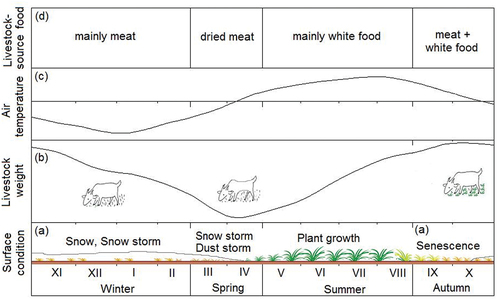
Figure 2. Total number of livestock in Outer Mongolia (thousand head), 1930–2019.
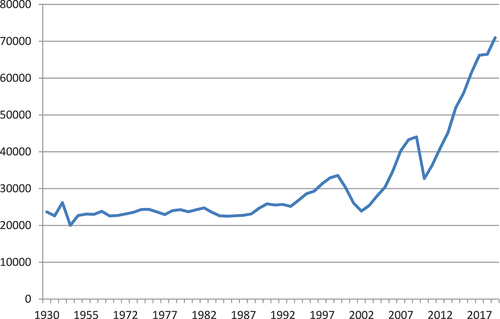
Figure 3. Model of pastoralism in Outer Mongolia during collectivization era.
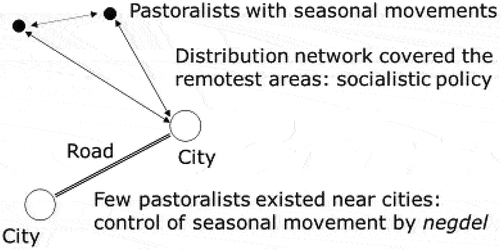
Figure 4. Number of pastoralists in Outer Mongolia (thousands, 1985–2011).
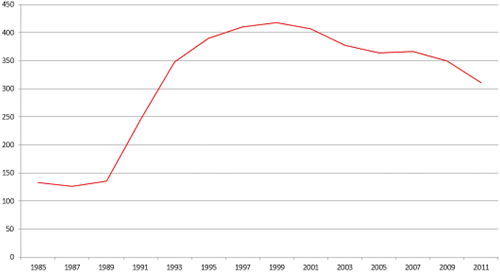
Figure 5. Model of pastoralism in Outer Mongolia during transitional period.
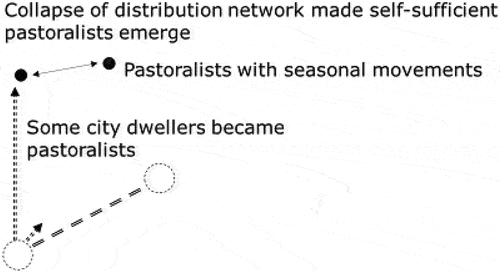
Figure 6. Nominal GDP in Outer Mongolia (in million TG).
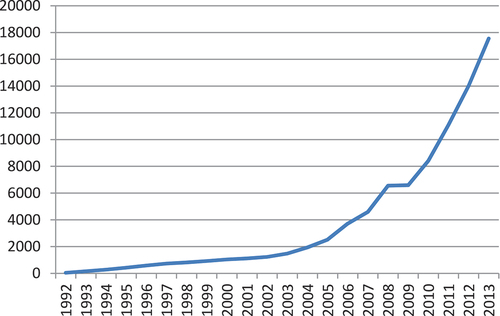
Figure 7. Rates of pastoralism (blue) and mining (red) in nominal GDP.
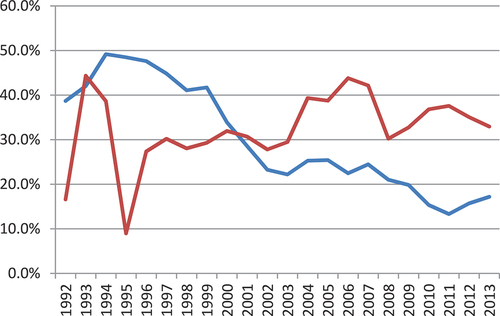
Figure 8. Model of pastoralism in today’s Outer Mongolia.
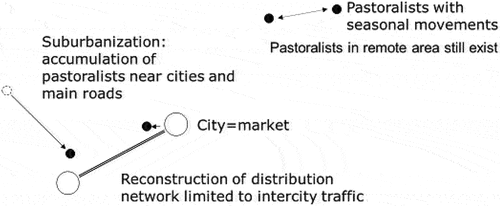
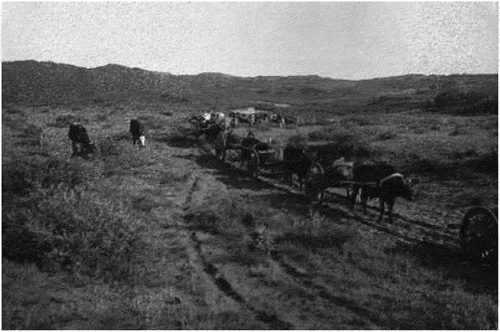
Photo 1. Chinese ox-wagon team at the Riverside of Nugas Gol, July 121931.