
Figures & data
Table 1. Linguistic responses and fuzzy scale transformation chart (Saaty Citation2008; Buyukozkan, Citation2004).
Table 2. Values of the Random Index (RI) (Saaty and Vargas Citation2001).
Table 3. Detailing important factors for evaluation of VRC Index.
Figure 1. Hierarchical VRC model.
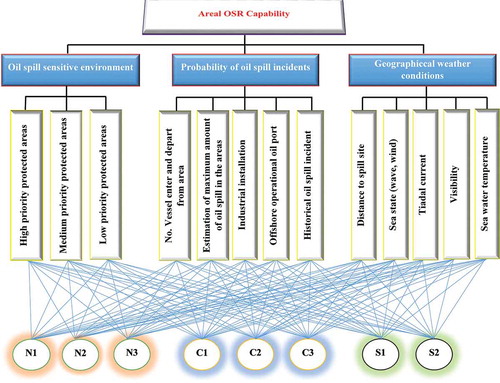
Figure 2. Flowchart of setting up OSRC.
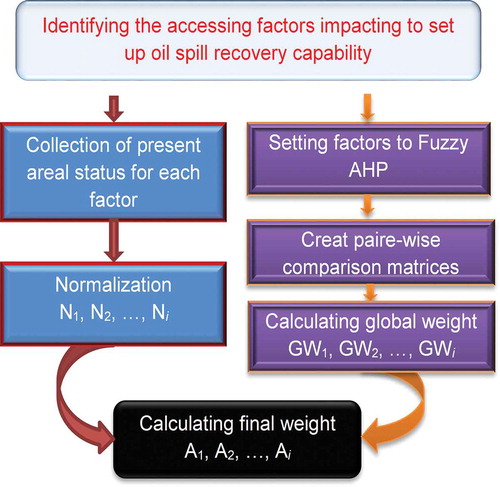
Figure 3. Sample pair-wise comparison matrices.
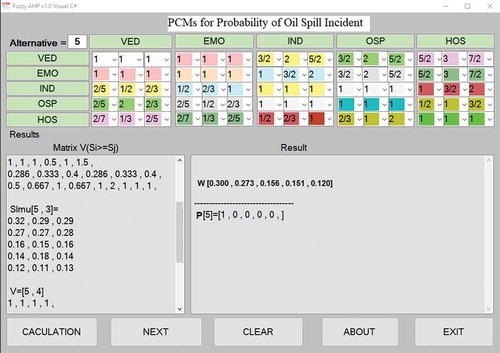
Table 4. Weighted scores for each factor by Fuzzy-AHP.
Table 5. Present status of areal probability factors.
Table 6. Present status of areal oil spill sensitivity factors.
Table 7. Present status of areal geographic conditions.
Table 8. Resulting average normalization of present status data.
Figure 4. A scenario of an oil spill response in Thanh Hoa area.
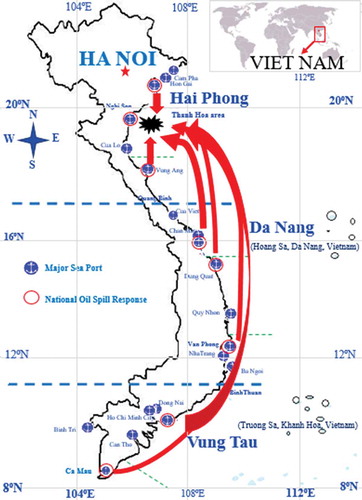
Table 9. Final weight for setting up OSRC for areas.
Table 10. Final weight and OSRC (4 days).
Table 11. Regional OSRC for the worst case discharge in North Region.
Table 12. Gathering OSRCs in Thanh Hoa area.