
Figures & data
Figure 1. Schematic diagram of the beaching method (Sujauddin et al., Citation2015).
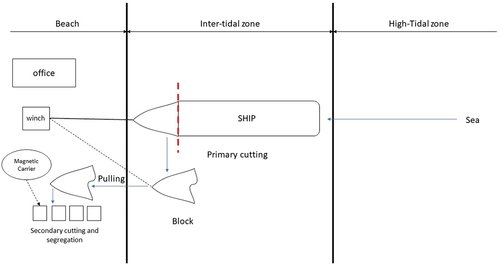
Figure 2. Schematic diagram of the slipway method.
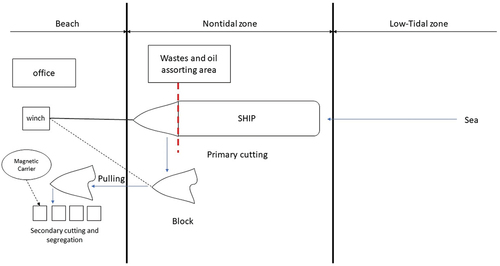
Figure 3. Schematic diagram of the alongside or afloat method.
Figure 4. Schematic diagram of the drydock method.
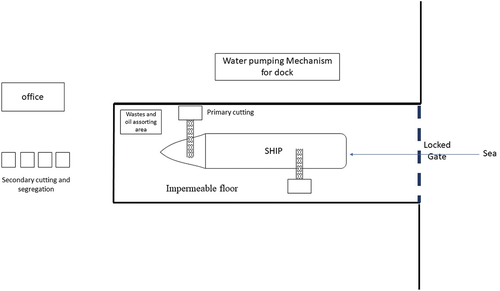
Table 1. Key regulations and conventions for EOL ships.
Figure 5. Methodological framework for conducting a systematic review with bibliometric analysis.
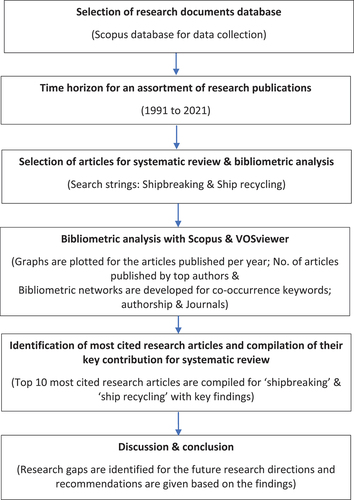
Figure 6. Evolution of shipbreaking and ship recycling research from 1991 to 2021.
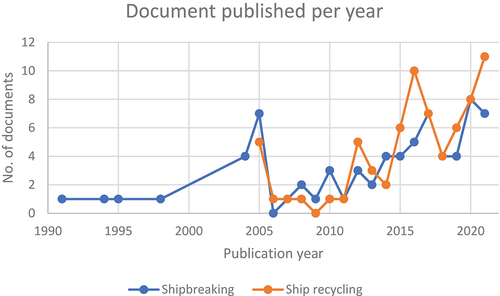
Figure 7. Bibliographic coupling analysis of sources/journals (a) shipbreaking (b) ship recycling.
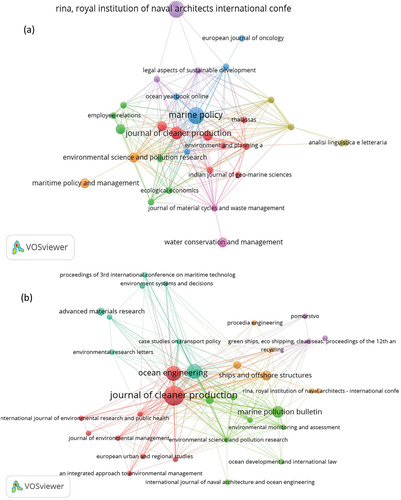
Figure 8. Article distribution percentage by subject area (a) shipbreaking (b) ship recycling.
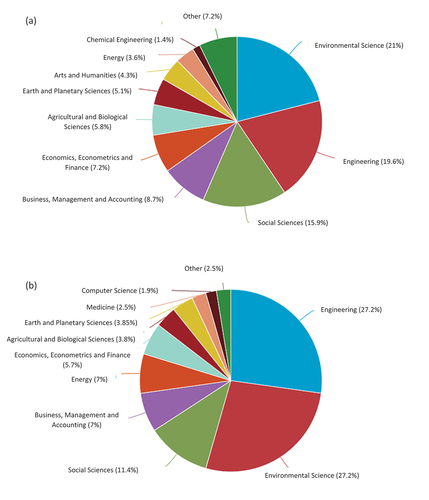
Figure 9. Top 15 countries that contributed to (a) shipbreaking and (b) ship recycling articles.
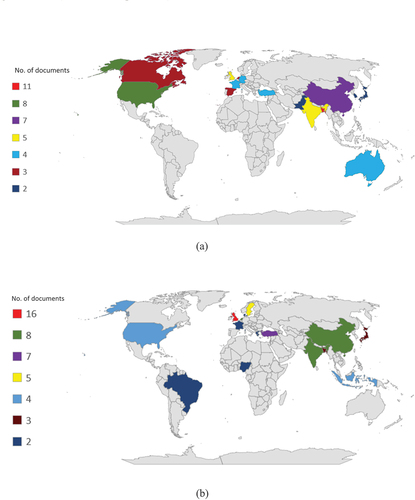
Figure 10. Bibliographic coupling analysis using authors of (a) shipbreaking and(b) ship recycling.
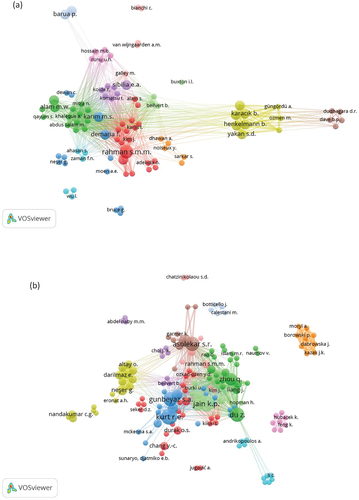
Figure 11. Bibliometric co-occurrence analysis of shipbreaking publications keywords (a) Network visualization (b) Density visualization and (c) Overlay visualization.
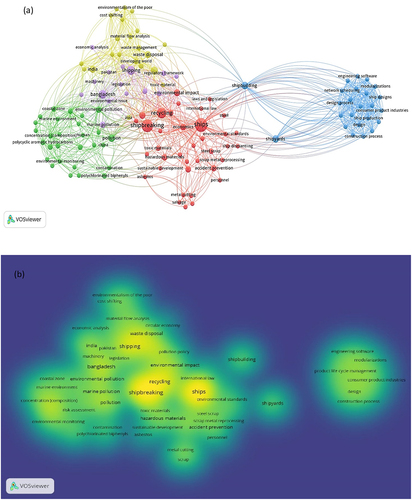
Figure 11. Continued.
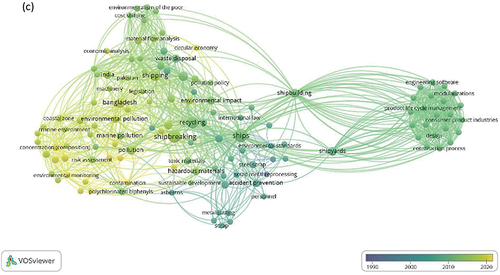
Figure 12. Bibliometric co-occurrence analysis of ship recycling publications keywords (a) Network visualization (b) Density visualization and (c) Overlay visualization.
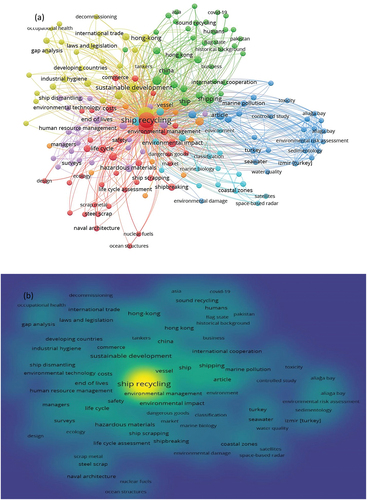
Figure 12. Continued.
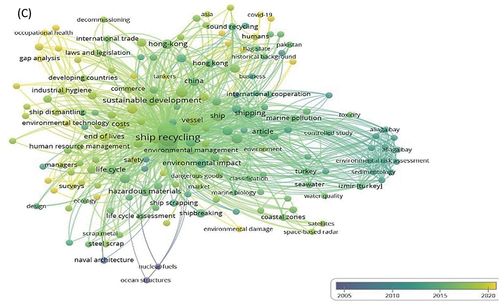
Table 2. Top 10 highly cited papers for shipbreaking from 1991 to 2021.
Table 3. Top 10 highly cited papers for ship recycling from 1991 to 2021.