Figures & data
Figure 1. Number of ships according to gross tonnage by ship type.
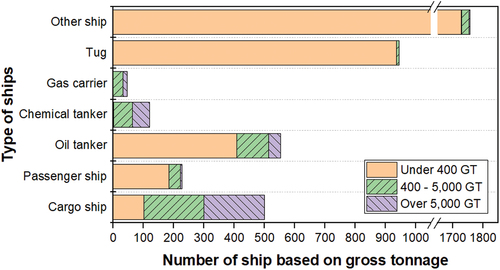
Figure 2. Proportion of ships according to the age.
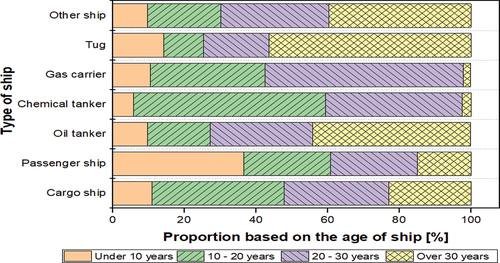
Table 1. Information for calculating ship’s fuel consumption.
Table 2. Greenhouse gas emission factors for ship fuel.
Table 3. Global warming potential value of GHG.
Figure 3. Annual fuel consumption per ship in 2021.
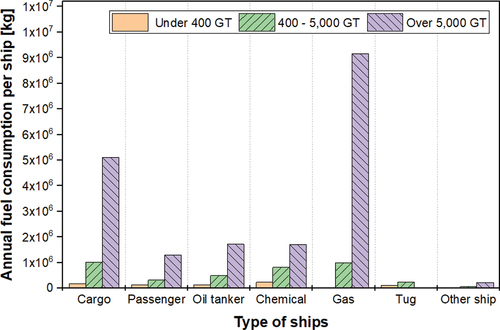
Table 4. Annual fuel consumption results for 4,151 Ships.
Figure 4. Comparison of greenhouse gas emissions by ship type.
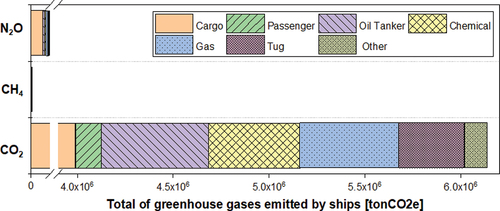
Figure 5. Comparison of greenhouse gas emissions by gross tonnage.
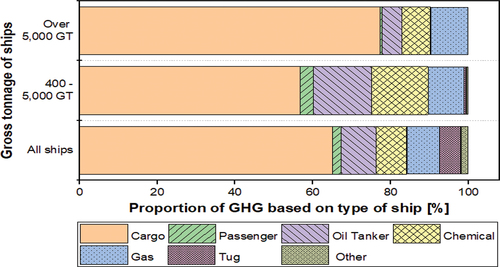
Figure 6. Comparison of GHG emissions from all ships and GHG emissions from ships in the 400 GT to 5,000 GT.
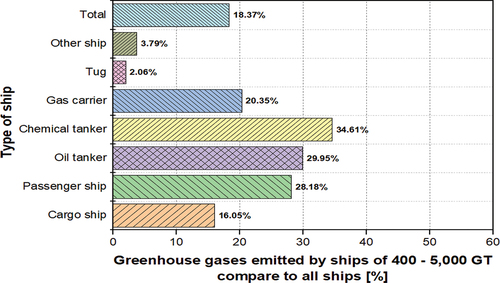
Figure 7. Comparison of GHG emissions from all ships and GHG emissions from ships in the over 5,000 GT.
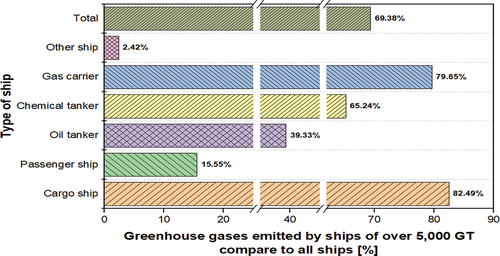
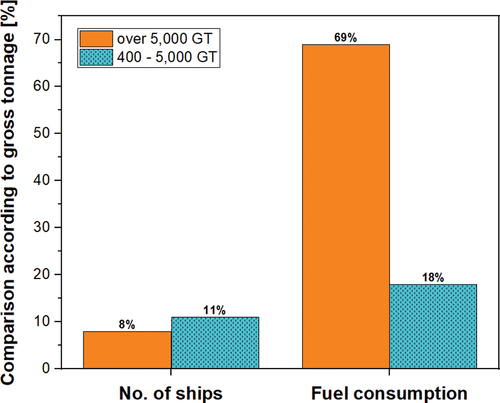
Figure 8. Comparison of the number of subject ships and fuel consumption by ship tonnage.