Figures & data
Table 1. Major and trace element chemistry of the ferromanganese ore sample C.
Table 2. Quantitative XRD (normalised to 100 wt%) of the ferromanganese Fine Ore C sample.
Figure 1. Representative photograph (a) and optical photomicrographs (b–g) of Fine Ore C particle textures (reflected plane polarised light). Key to Figure labels for b–g: H – hematite, Mph – microplay hematite, BH – botryoidal hematite, Nh – Sub-micron hematite, G – goethite, B – braunite, C – cryptomelane, P – pyrolusite, Po – porosity, Py – pyrite and Q – quartz.
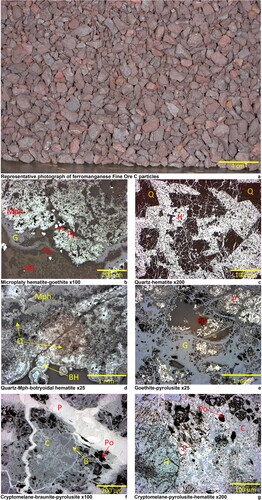
Table 3. Mean contents of selected major elements for EPMA analyses on representative particles from Lump Ore A and Lump Ore B.
Table 4. Listed densities for relevant minerals (g/cm3).
Table 5. Apparent density and envelope density measurements for selected lump ore particles.
Table 6. Major element chemistry data (wt%) for the IRMS test work at a particle top size of 4.7 mm.
Table 7. Major element chemistry data (wt%) for the IRMS test work at a particle top size of 2.3 mm.
Table 8. Major element chemistry data (wt%) for the IRMS test work at a particle top size of 1 mm.
Figure 2. Representative optical photomicrographs of particles from the magnetic and tails fractions from IRMS test #2. Key to Figure labels: H – hematite, HH – hydrohematite, Mph – microplay hematite, Nh – sub-micron hematite, Mn – manganese oxide, G – goethite, B – braunite, C – cryptomelane, P – pyrolusite, Po – porosity and Q – quartz.
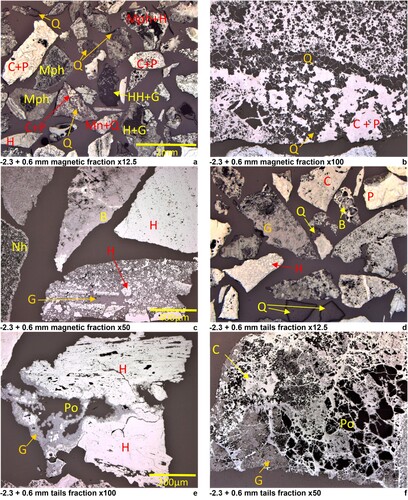
Table 9. Comparison of calculated QEMSCAN ™ assay data for Mn, Fe and Si for the magnetic fraction and tails fraction from IRMS test #2, with XRF analysis values.
Table 10. Calculated modal mineralogy for the magnetic fraction and the tails fraction for the IRMS test #2 (−2.3 + 0.6 mm).
Table 11. Calculated Mn deportment (% of total Mn in fraction) of each QEMSCAN™ phase in the magnetic fraction and tails fraction from the IRMS test #2.
Figure 3. Mineral association data for the magnetic fraction and for the tails fraction for (a) ‘Mn oxides’ (b) ‘Fe oxides’ and (c) ‘Quartz’ for IRMS test #2.
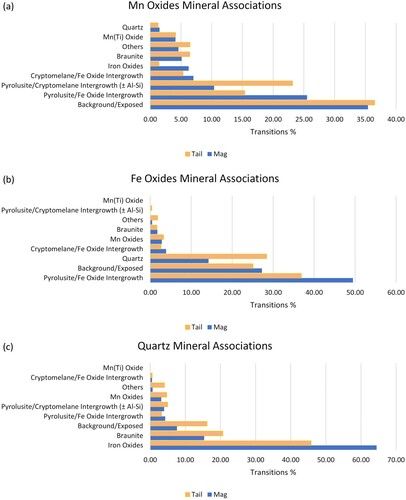
Table 12. Liberation data for the magnetic fraction and for the tails fraction for ‘Mn oxides’, ‘Fe oxides’ and ‘Quartz’ presented by liberation class for IRMS test #2.
Figure 4. Grain size distribution for broad mineral groupings for the (a) magnetic fraction and (b) tails fraction for IRMS test #2.
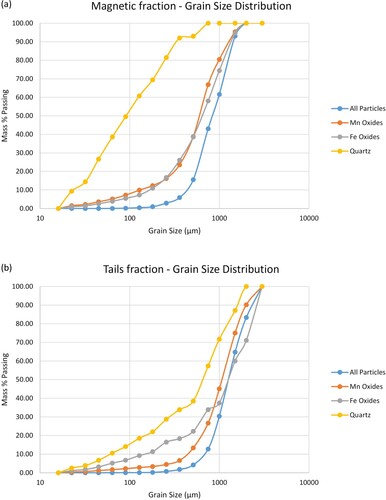
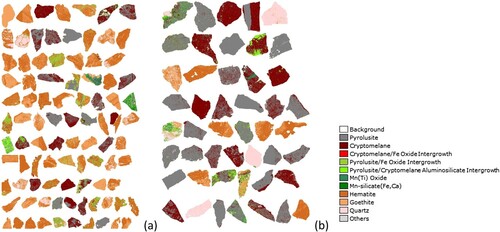
Figure 5. False colour image of selected larger particles (sorted by area) from the QEMSCAN™ particle map for (a) the magnetic fraction and (b) the tails fraction for IRMS test #2.