
Figures & data
Figure 1. The distribution of the two types of knowledge among the respondents (N = 664).
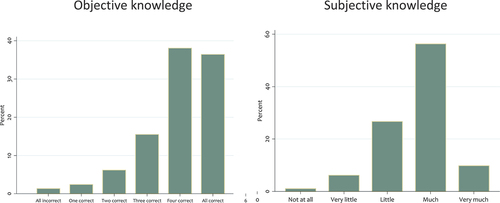
Figure 2. The effects on objective and subjective knowledge.
Note: The regression coefficients are presented in Appendix 2.
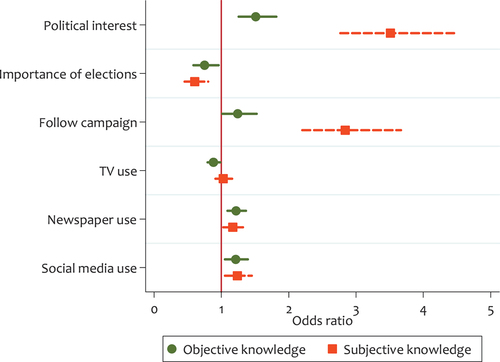
Figure 1. The distribution of the two types of knowledge among the respondents (N = 664).
Figure 2. The effects on objective and subjective knowledge.