
Figures & data
Figure 1. Tax revenue development. Note: For RR countries, non-commodity revenue is computed by subtracting commodity revenue and grants from general government (GG) revenue. Sources: WoRLD, WEO, and IMF staff estimates.
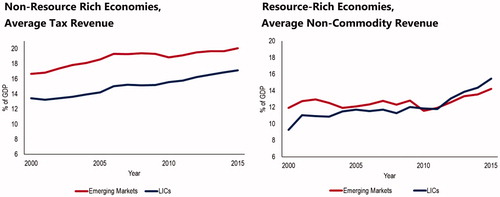
Figure 2. Tax revenue composition. Note: Resource-Rich data are in terms of percent of non-commodity revenue. Sources: World Revenue Longitudinal Database and IMF staff estimates.
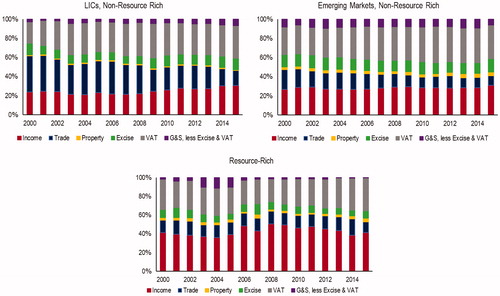
Figure 3. Distribution of 172 identified episodes. Sources: WoRLD and IMF staff estimates.
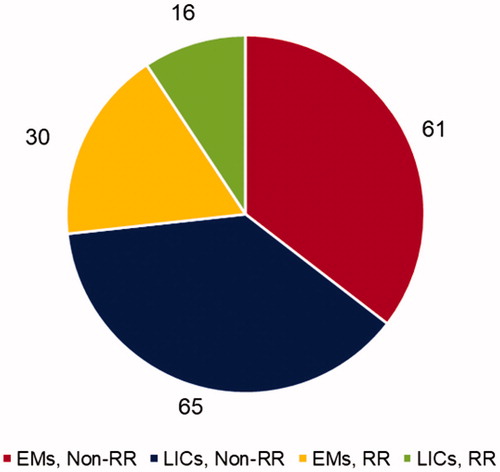
Figure 4. Comparison of tax revenue to GDP per capita performance matrix. Notes: Comparisons made to line of best fit based on 2015 values by country group. The residual from the 2015 line of best fit is compared to the percentile. Below the 15th percentile is classified as “Poor,” between the 15th and 50th percentile is “Low,” from 50th to 85th is “Good” and above 85th is “High.” Source: IMF staff estimates.
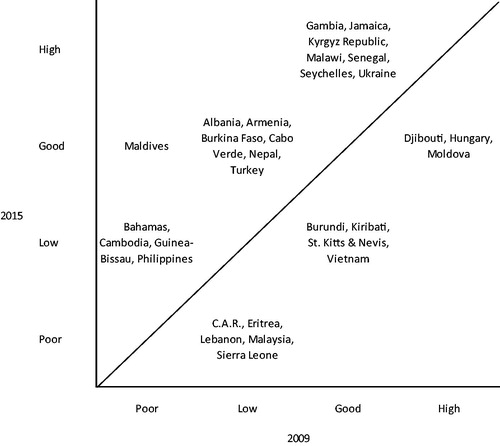
Figure 5. Episode duration. Note: Episodes are defined as 3-year compounded windows of an average increase of 0.5 percent per year or more. The first episode is triggered by the first 3-year window in which the tax-to-GDP ratio increases by an average of at least 0.5 percent per year (1.5 percent within three years). Sources: WoRLD, WEO, and IMF staff estimates.
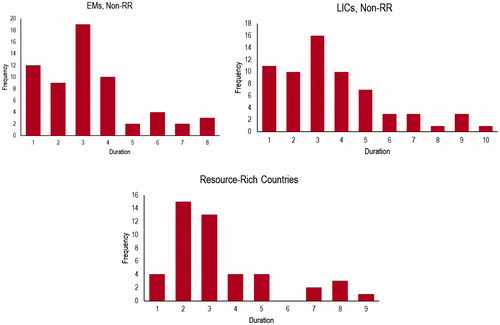
Figure 6. Initial revenue ratios at the onset of successful revenue mobilization. Note: Vertical lines represent the “tipping point” of tax revenue to GDP in Gaspar, Jaramillo, and Wingender (Citation2016a) and Gaspar, Jaramillo, and Wingender (Citation2016b), which finds that countries which achieve a tax-to-GDP rate of at least 12.75 experience sustained economic growth. Even past this tipping point, the data displays room from improvement. Sources: WoRLD, WEO, and IMF staff estimates.
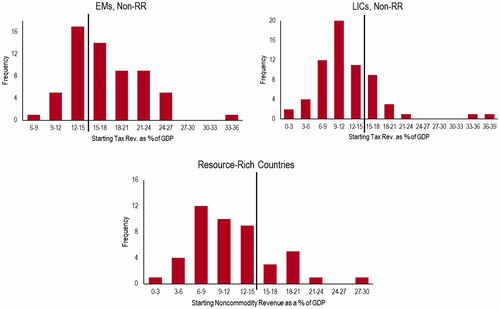
Figure 7. Short-term sustainability of revenue increase. Notes: Sustained indicates that revenue increased/stayed the same for at least three years after the revenue period ended (two years for episodes ending in 2015). Fell moderately indicates revenue fell by less than one third of the overall increase. Fell strongly indicates a fall of more than one third of the overall increase.
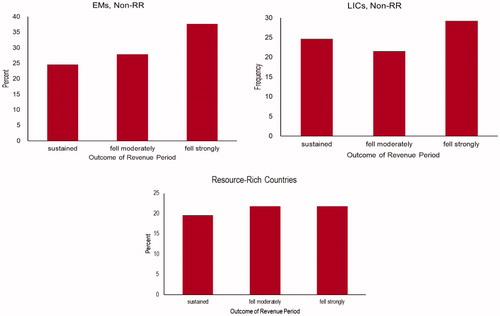
Table 1. Summary of identified episodes.
Figure 8. Frequency of tax policy instruments (in percent). Note: Ratio of observations in a specific category to total identified discretionary measures. Source: IMF staff estimates.
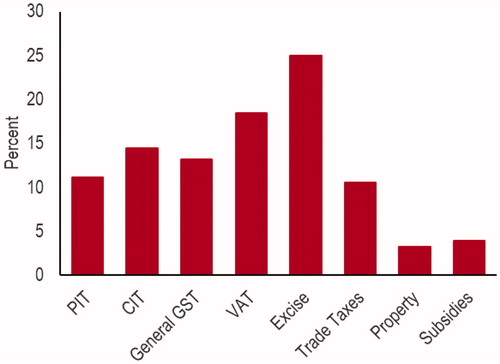
Figure 9. Number of tax policy instruments used per episode. Source: IMF staff estimates.
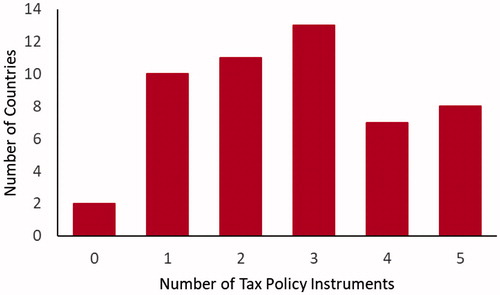
Figure 10. Frequency of introductions, rate and base changes. Source: IMF staff estimates.
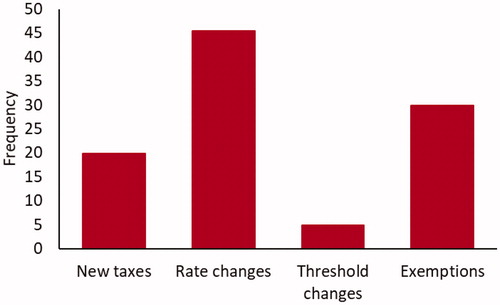
Table 2. Introductions, rate and base changes.
Figure 11. Revenue administration measures. Source: IMF staff estimates.
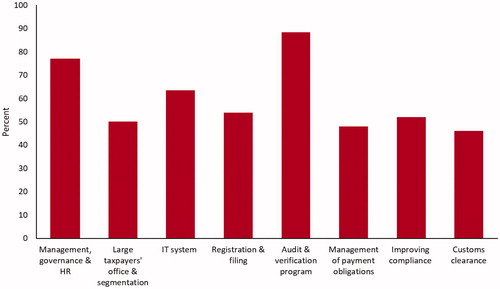
Figure 12. Number of revenue administration instruments used. Source: IMF staff estimates.
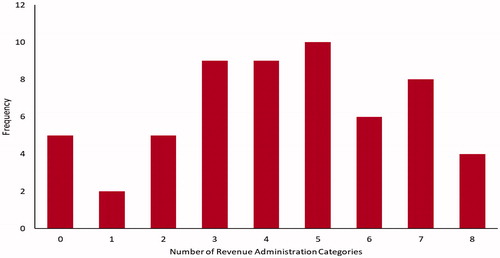
Table A1.1. Development classification.
Table AI.2. Regional classification.
Table A2.1. Summary Statistics, as a percent of GDP, 2000–2015.
Table AII.2. Tax revenue average by region (EMs and LICs), 2000–2015, as a percent of GDP.