Figures & data
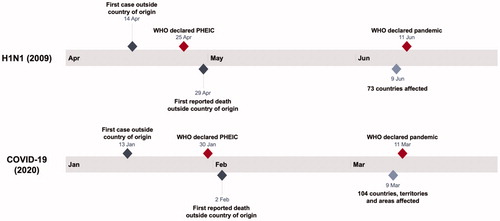
Figure 1. Number of confirmed cases (left axis) and deaths (right axis) due to COVID-19 outside China (January 13-March 31, 2020). Source: WHO situation reports (Citation2020q).
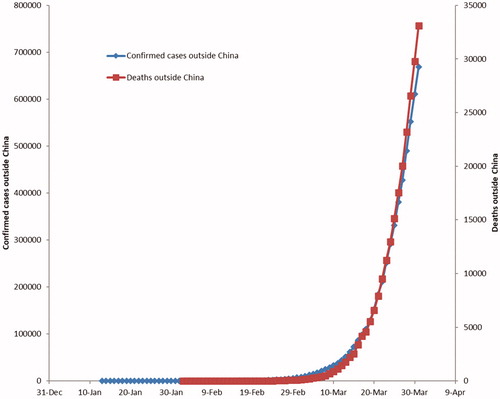
Figure 2. Timelines of global events within the first three months of the H1N1 and COVID-19 outbreaks.