
Figures & data
Figure 1. Theoretical framework based on the JD-R model.
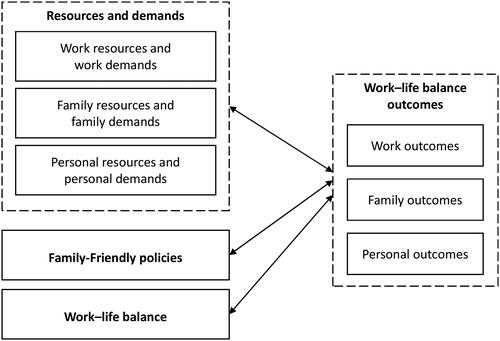
Table 1. Descriptive statistics of respondents.
Table 2. Statistics for resource and demand factors and WLB outcome factors.
Table 3. Spearman’s correlation coefficients regarding resource and demand factors and WLB outcome factors.
Table 4. Comparison of the correlations between resource and demand factors and WLB outcome factors for Hong Kong and Thailand university staff (fisher z-transformation).