Figures & data
Figure 1. Graphical representation of HIV transmission. Susceptible individuals flow into the undiagnosed (I) via infection rate. Unaware individuals recieve diagnosis and flow into and
based on the CD4 cell counts. The tested individuals are then linked to ART treatment in classes
and
.
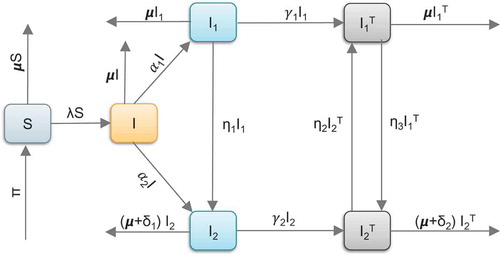
Table 1. Parameter values and ranges per year obtained from data fitting
Figure 2. (a) shows the trend of new HIV infections while (b) shows the projected new HIV infections in Kenya by 2030.
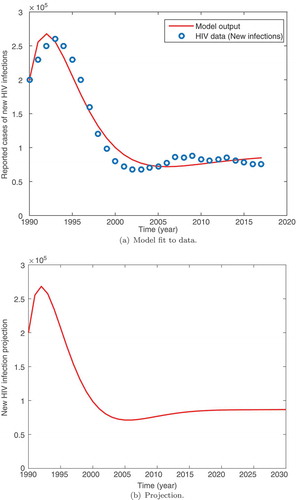
Table 2. Parameter values and ranges used in numerical simulations as well as determination of sensitivity indices of . The parameter rates are given per annum
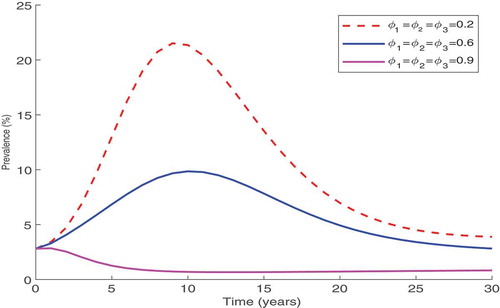
Figure 3. Simulation result showing the effect of efforts made to protect susceptible individuals from infections on the disease prevalence.
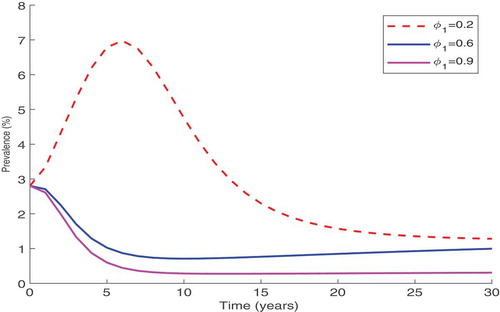
Figure 4. Simulation result showing the testing and counselling on the disease prevalence.
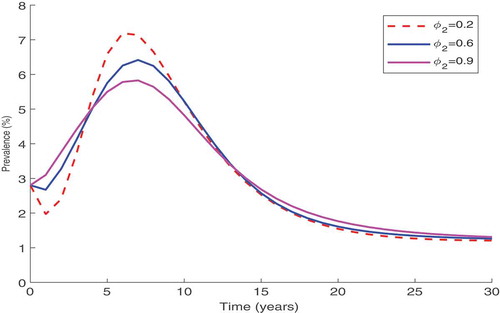
Figure 5. Simulation results showing the advantage of combining personal protection, testing and counselling and ART treatment on the disease prevalence.