
Figures & data
Table 1. Changes of E(γm), Dγ, and RDγ with the increase of m at different γ0 levels, where Dγ = 100(E(γm)−γ0)/γ0 and RDγ = 100(γm−γm+1)/γm+1
Figure 1. The m–E(γm) relationship curve at γ0 = 0.2 and 0.15 as determined by Equation (14).
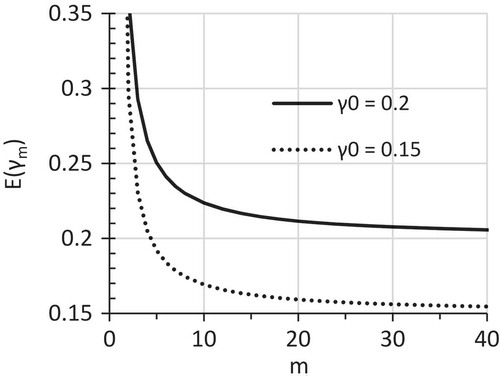
Figure 2. Effects of γ0 levels on Dγ as defined by Equation (15) and RDγ as defined by Equation (16): a. Dγ at m = 5; b. Dγ at m = 2.
Figure 3. Effects of m on γm at δ = 29% for analytic model = Anal-2: a. MI model = MI-1; b. MI model = MI-2.
Table 2. Coefficient of variations (%) of Bm, Um, and γm for SIZE100
Table 3. Comparison of different γ0 estimation methods for SIZE20 with imputation model = MI-2 and analytic model = Anal-2 in the PWS12 MI trials. The best γ̂0 was calculated by Equation (19) using (B̅100)/(U̅100) as the estimate of B0/U0, where B̅100 and U̅100 were the mean of the 30 replicates of B100 and U100, respectively