Figures & data
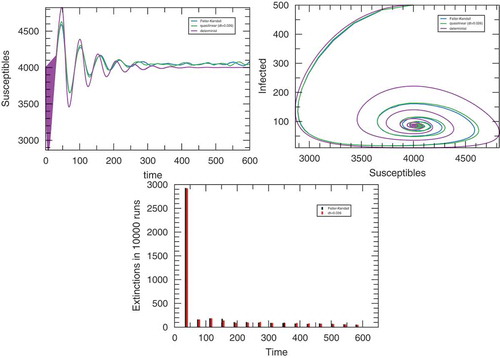
Figure 1. Simulation outputs of the SIRS model for and
for the approximated stochastic simulation. The upper left panel displays the average time-trace of the number of infected individuals. Upper right: average trace of the trajectory in the
plane. The bottom panel displays the number of process in which the infected population became extinct. In all cases,
simulations where performed.
![Figure 1. Simulation outputs of the SIRS model for S0=6000,rr=0.8,ri=0.0002,rs=0.02 and dt=0.02 for the approximated stochastic simulation. The upper left panel displays the average time-trace of the number of infected individuals. Upper right: average trace of the trajectory in the (S,I) plane. The bottom panel displays the number of process in which the infected population became extinct. In all cases, 104simulations where performed.](/cms/asset/85f4cec4-26d1-4836-b577-48427833c50b/oama_a_1556192_f0001_oc.jpg)