
Figures & data
Table 1. Hellinger distances for the pdQ method with different weighting methods for step 1 and either distributional least squares or quartile matching for step 2
Table 2. Hellinger distances comparing the performance of the moments, percentile matching and pdQ with quartile matching methods
Figure 1. Plots of the true and approximating GLD probability densities for several distributions using the moment matching (green), percentile matching (blue) and pdQ (red) methods. The true probability density is the black curve.
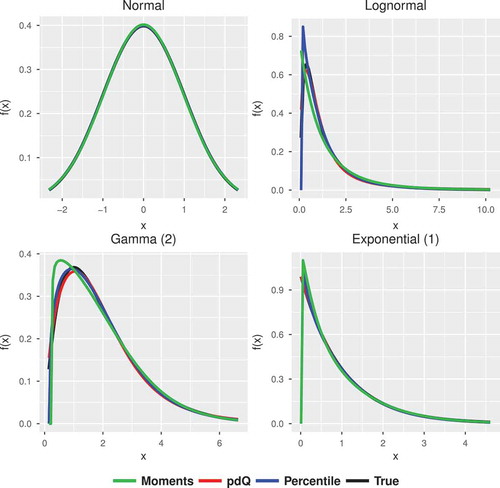
Figure 2. Plots of the pdQ for several distributions using the percentile matching (blue) and pdQ (red) methods. The true pdQ is the black curve.
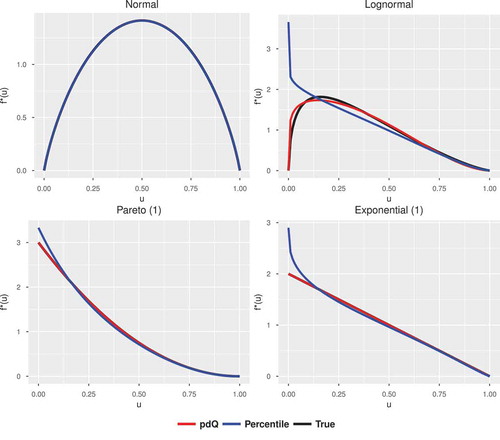
Table 3. Parameters chosen for the generalized lambda distribution using the pdQ method and quartile matching
Table 4. Parameters chosen for the generalized beta distribution with Hellinger distance using pdQ method with quartile matching to choice the best parameters