Figures & data
Figure 1. A compartmental representation of the epidemic of alcohol-methamphetamine co-use.
Table 1. Descriptions of co-abuse model parameters
Table 2. Description of parameters of the co-abuse model, their values and their ranges
Figure 2. Graphs showing the population dynamics of ,
,
,
,
,
and
for
. Used parameter values are available in Table .
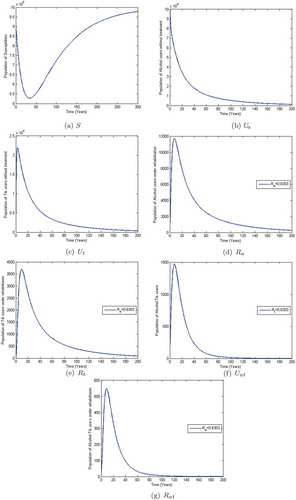
Figure 3. Graphs showing the population dynamics of ,
,
,
,
,
and
for
. Used parameter values are available in Table 2.
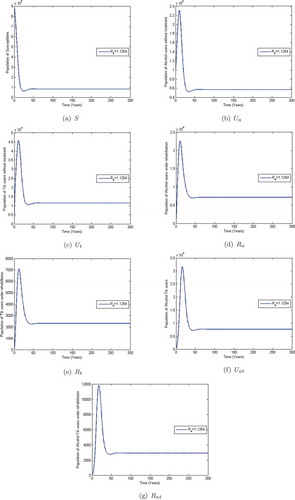
Figure 4. PRCCs for the full range of parameters from Table .
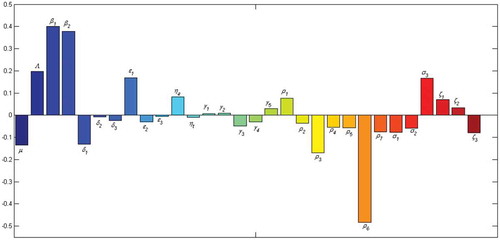
Figure 5. Graphs (a), (b), (c) and (d) show the Monte Carlo simulations for the four parameters with the greatest PRCC magnitude in the alcohol model. Parameter values in Table and ,000 simulations per run were used.

Figure 6. Graphs (a), (b), (c) and (d) show the Monte Carlo simulations for the four parameters with the greatest PRCC magnitude in the methamphetamine (MA) model. Used parameter values can be found in Table (2). One thousand simulations per run were used.
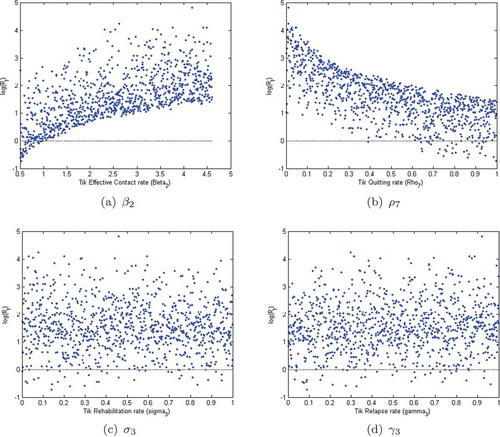
Table 3. Primary Methamphetamine-abuse for the period 1997a to 2016b in % (Source: (Siphokazi et al., Citation2017)). The letters a and b represent the first 6 months (January–June) and the second 6 months (July–December) of the year, respectively
Table 4. Primary Alcohol abuse: by 6-month period (from 1997a to 2016b in % (Source: (Siphokazi et al., Citation2017))
Figure 7. Shows methamphetamine model (37) fitted to data for addicts seeking treatment for methamphetamine as a primary substance of abuse in the Western Cape Province of South Africa. Parameter values are in Table (2).
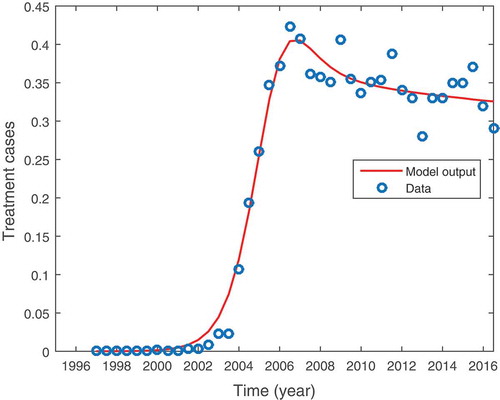
Figure 8. Shows alcohol-model (15) fitted to data for individuals seeking treatment for alcohol abuse in Cape town and Western Cape province of South Africa. Parameter values are in Table (2).
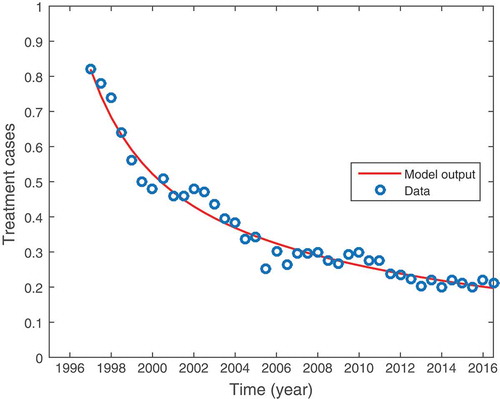
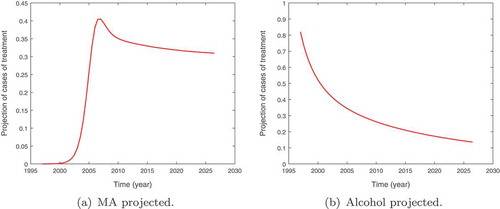
Figure 9. Graphs showing the projected population of methamphetamine (MA), (a) alcohol (b) abuse patients seeking treatment services in Western Cape province, South Africa.