
Figures & data
Figure 1. Algorithm to compute the final scores for ambulation in HUI3. (Y = Yes, N = No, LVL = Level).
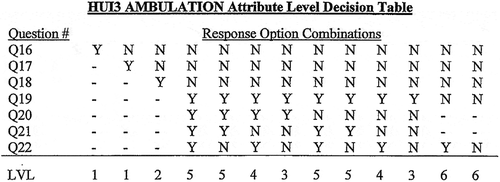
Table 1. HUI Test data. The first column represents participants and columns are their responses to the HUI questions (y = Yes, n = No).
Table 2. HUI Test data (continued). The first column represents participants and columns are their responses to the HUI questions (y = Yes, n = No, h = happy, u = unhappy).
Table 3. An example of the output from SAS COMPARE procedure: Here comparing the HUI version and our version of the HUI2 domains from the test data
Table 4. Fit Blue Screening visit HUI data processed through the %HUI macro