Figures & data
Figure 1. Plots of density and hazard rate functions of CB distribution
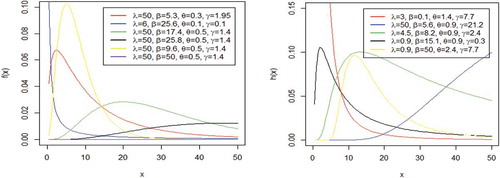
Figure 2. Plots of the density and hazard rate function of CK distribution
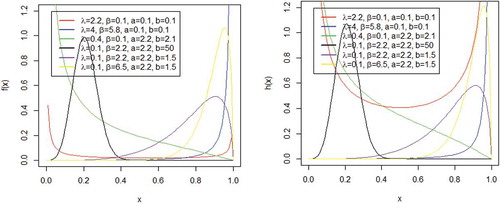
Figure 3. Plots of density and hazard rate function of CW distribution
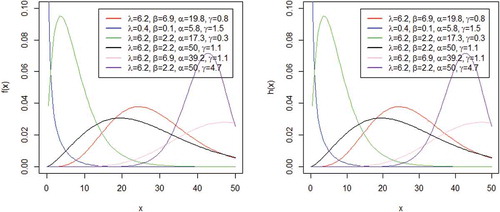
Table 1. Monte Carlo simulation results
Table 2. Fatigue time of 101 6061-T6 aluminum coupons
Table 3. Survival times of guinea pigs injected with different amounts of tubercle bacilli
Figure 4. TTT-transform plots for the datasets
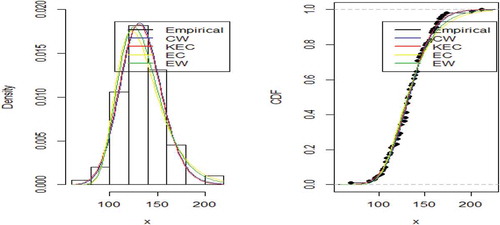
Table 4. Maximum likelihood estimates and standard errors of parameters in brackets
Table 5. Goodness-of-fit statistics and information criteria
Figure 5. Empirical and fitted density and cdf plots of data1
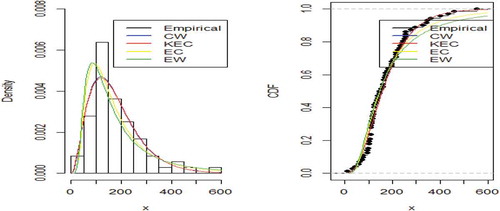
Figure 6. Empirical and fitted density and cdf plots of data2
Figure 7. P-P plots of fitted distributions for data1
Figure 8. P-P plots of fitted distributions for data2
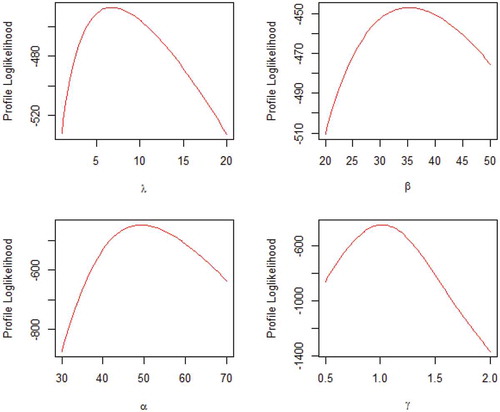
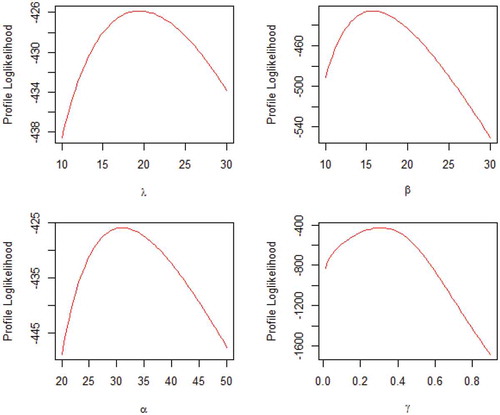
Figure 9. Profile log-likelihood plot of CW parameters for data1