
Figures & data
Figure 1. Categorisation of propositional and performance knowledge.
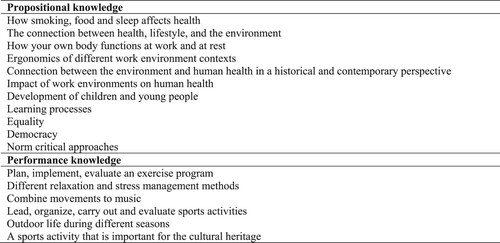
Table 1. Swedish or migration background, frequencies.
Table 2. PETE students’ parents’ experience of club sports as participants or leaders, frequencies.Table Footnotea
Table 3. PETE students’ previous and present experiences of physical activity and sports, percentage.
Table 4. PETE students’ preferred physical activities, 1 = totally disagree, 5 = totally agree (mean values and standard deviations).
Table 5. PETE students’ reason to applying to the study programme, 1 = totally disagree, 5 = totally agree (mean values and standard deviations).
Table 6. PETE students’ support and encouragement from their surroundings and significant others, 1 = totally disagree, 5 = totally agree (mean values and standard deviations).
Table 7. PETE students’ ratings of their abilities in different areas before enrolment, 1 = did not master, 4 = completely mastered (mean values and standard deviations).
Table 8. PETE students’ ratings of their propositional and performance knowledge before enrolment, 1 = did not master, 4 = completely mastered (mean values and standard deviations).