
Figures & data
Figure 1. Operating nuclear capacity projections by US and international organizations. Early projections covered time frames until 2000.
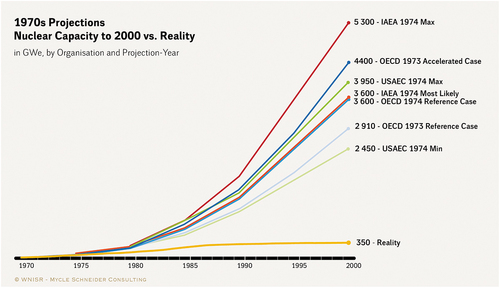
Figure 2. Construction starts of commercial nuclear reactors in the world 1951–2022.
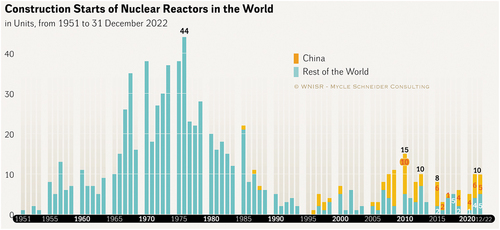
Figure 3. The spread of national nuclear power programs 1954–End of 2021. Although South Korea is listed under the “Program Limitation or Phase-out” category, the current administration plans to reverse the previous government’s long-term phaseout policy. There are also four reactors being constructed.
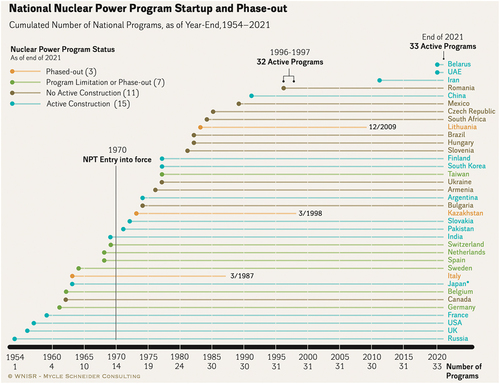
Figure 4. Operating reactors and their net operating capacity worldwide.
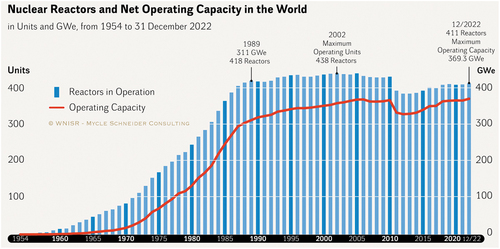
Table 1. Operational power reactors and power reactors under construction and their IAEA safeguards status in nuclear-armed states as of the end of 2020.