
Figures & data
Figure 1. Schematic of the photoionization detector PID. The UV lamp, filled with Kr gas at low pressure, generates photons with the energy of 10.6 eV using a RF field that induces and sustains a glow discharge when applied onto a set of two opposite metallic plates placed externally to the lamp body. The lamp is a glass body (1/2” o.d. and ca. 4 cm length) with a soldered disc of material transparent to ultraviolet radiation (MgF2 for 10.6 eV lamps).
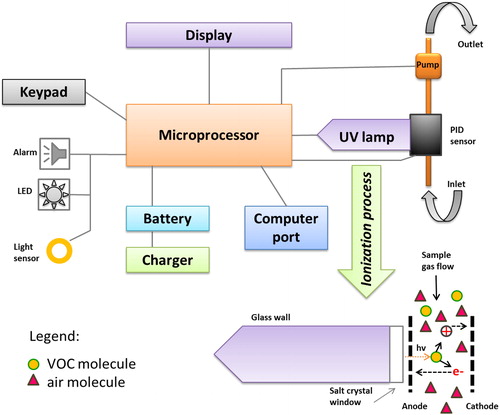
Figure 2. PID instrument ppbRAE Plus (A), sealed containers ready for analysis (B) and sample collection using head-space technique (C and D).
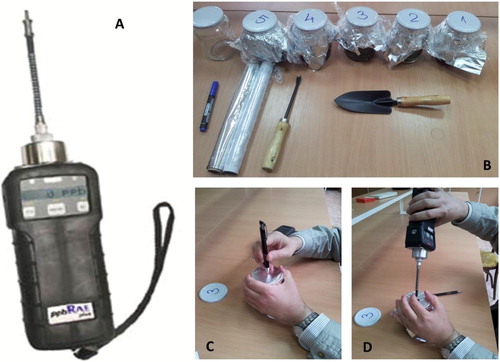
Table 1. Characterization of analyzed soil sample.
Figure 3. The temporal evolution of diesel fuel vapours profile.
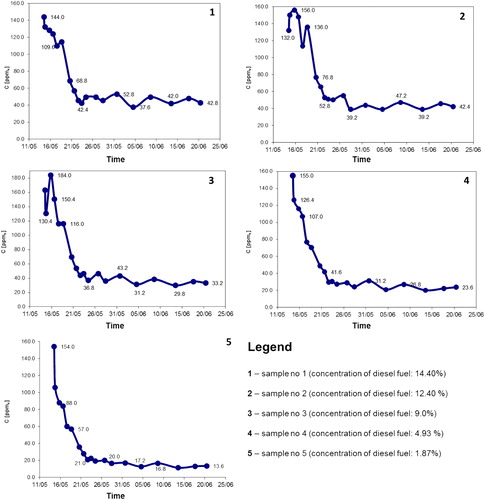
Table 2. Concentrations of diesel fuel recorded during experimental champagne.