
Figures & data
Table 1. Values of computational and approximate solutions for
Figure 1. Distinct graphs of EquationEq. (4)(4)
(4) in three different types (3 D, 2 D, contour) for its real, imaginary and absolute values.
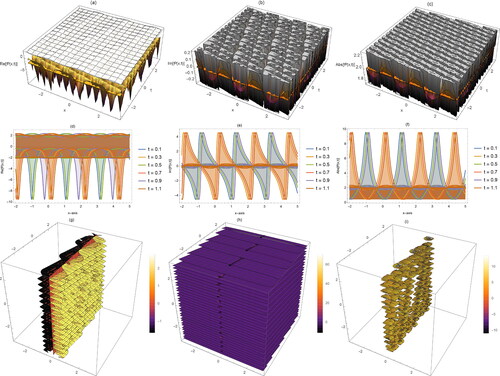
Figure 2. Distinct graphs of EquationEq. (5)(5)
(5) in three different types (3 D, 2 D, contour) for its real, imaginary and absolute values.
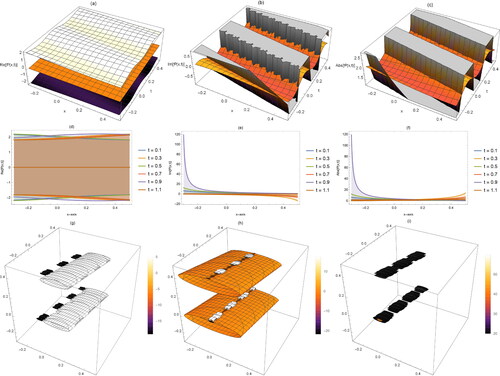
Figure 3. Distinct graphs of EquationEq. (6)(6)
(6) in three different types (3 D, 2 D, contour) for its real, imaginary and absolute values.
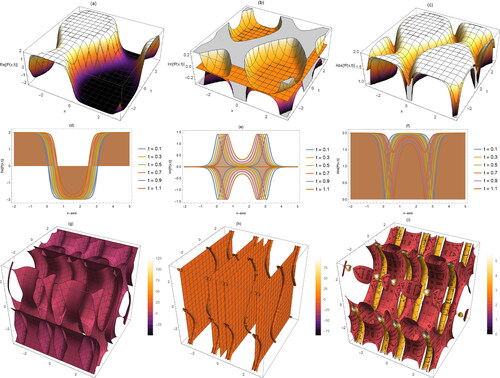
Figure 4. Distinct graphs of EquationEq. (7)(7)
(7) in three different types (3 D, 2 D, contour) for its real, imaginary and absolute values.
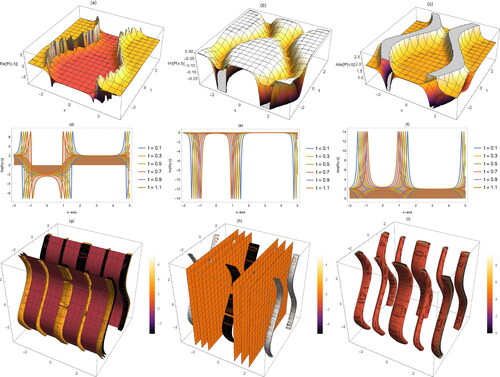
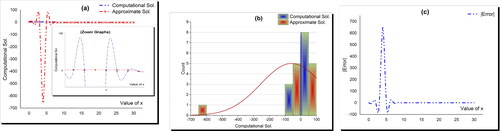
Figure 5. Matching between computational and approximate solutions based on the calculated values in .
Data availability statement
The data that support the findings of this study are available from the corresponding author upon reasonable request.