Figures & data
Figure 1. Comparison of the approximate solution of Problem 1 for distinct values ζ w.r.t. the exact solution and absolute error with n = 1,
and
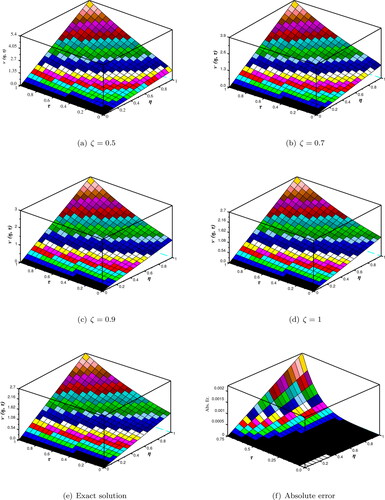
Figure 2. Comparison between the approximate solution at and the exact solution with
n = 1, and η = 1 for Problem 1.
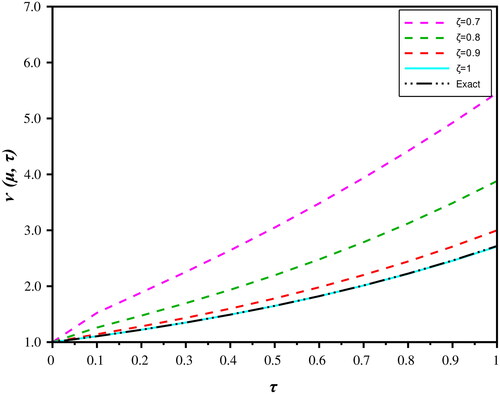
Figure 3. n-curves of for distinct values of ζ with
and
for Problem 1.
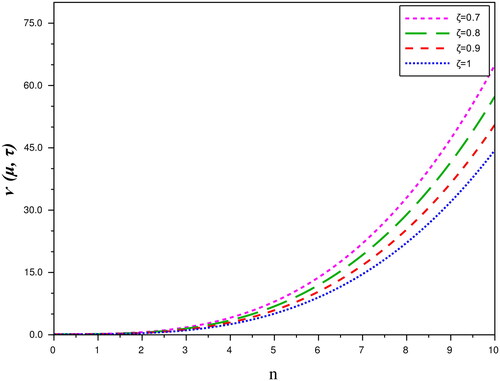
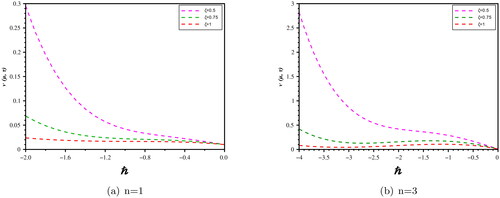
Figure 4. The -curves of
for distinct values n with
and
for Problem 1.
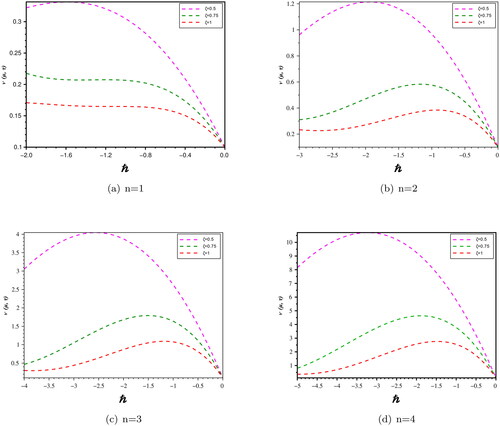
Table 1. q-Homotopy analysis Shehu transform method for in comparison with RPSM (Wang et al., Citation2019), HATM (Wang et al., Citation2019), and HPTM (Singh & Kumar, Citation2018) at
= −1, ζ = 1, and n = 1 for Problem 1.
Table 2 q-Homotopy analysis Shehu transform method for in comparison with RPSM (Wang et al., Citation2019), HATM (Wang et al., Citation2019), and HPTM (Singh & Kumar, Citation2018) at
= −1, ζ = 1, and n = 1 for Problem 2.
Figure 5. Comparison of approximate solution of Problem 2 for distinct values ζ w.r.t. the exact solution and absolute error with n = 1,
and
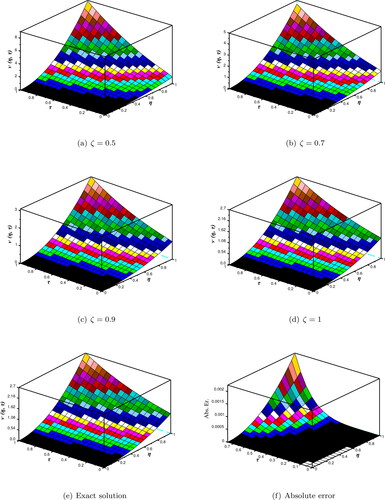
Figure 6. Comparison between the approximate solution at and the exact solution with
n = 1, and η = 1 for Problem 2.
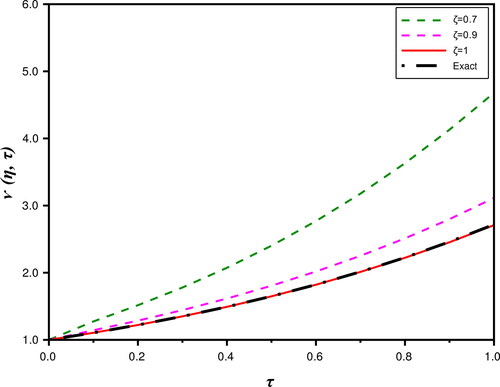
Figure 7. n-curves of for distinct values of ζ with
and
for Problem 2.
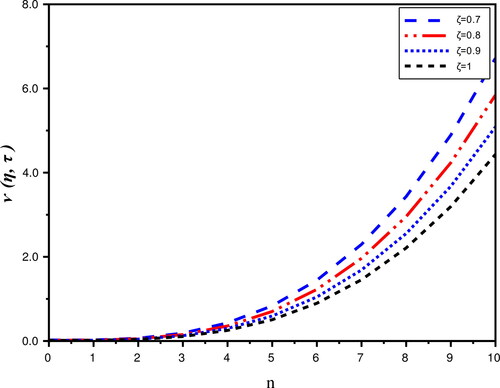
Figure 8. The -curves of
for distinct values n with
and
for Problem 2.