Figures & data
Figure 1. Schematic experimental protocol for the preparation of Eu-doped ZnO nanopowders.
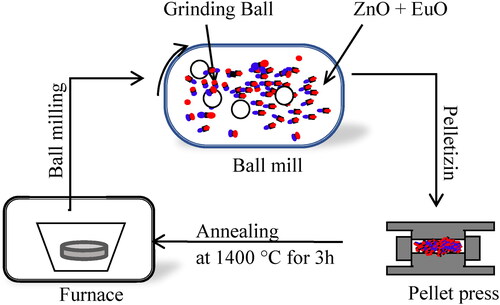
Figure 2. TGA and DTA curves of ZnO and Eu-doped ZnO samples with different Eu concentrations.
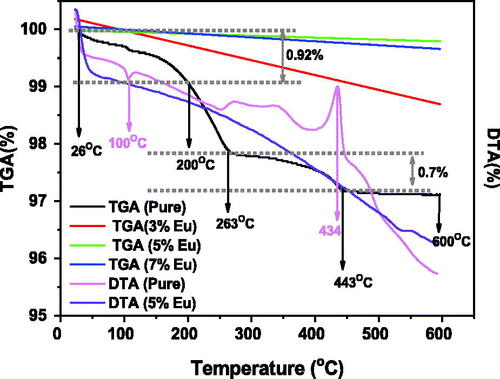
Figure 3. XRD patterns of undoped and Eu- doped ZnO samples (a), (b) Rietveld refinement of X-ray diffraction pattern of 5% Eu-doped ZnO nanopowder, Zoom on (100) peaks in the XRD patterns for the undoped and Eu-doped ZnO (c).
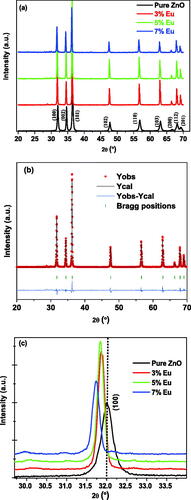
Table 1. Band gap energy, lattice parameters, unit cell volume, bond length, micro-strain and grain size of the undoped and Eu-doped ZnO samples.
Figure 4. Williamson–Hall plots for the undoped (a) and Eu-doped ZnO samples (b, c and d).
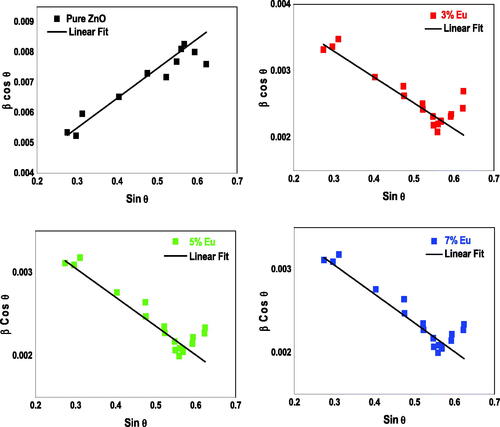
Figure 5. SEM images of the prepared nanopowders: undoped (a) and Eu-doped ZnO samples.
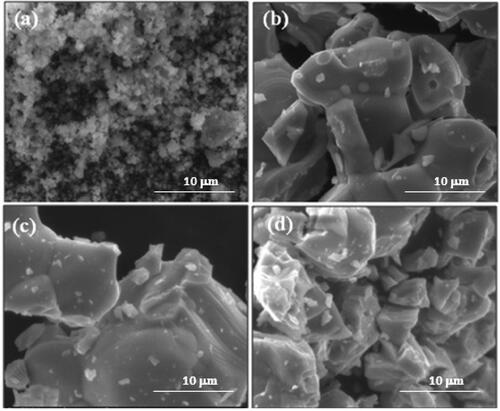
Figure 6. TEM images for (a) undoped ZnO and (b) 5% Eu-doped ZnO sample.
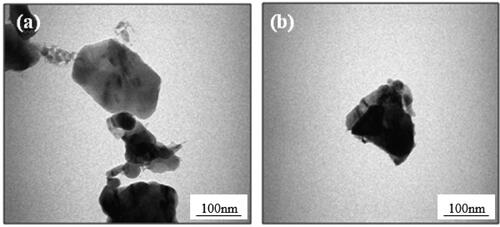
Figure 7. FTIR spectra measured for the undoped and Eu- doped ZnO samples.
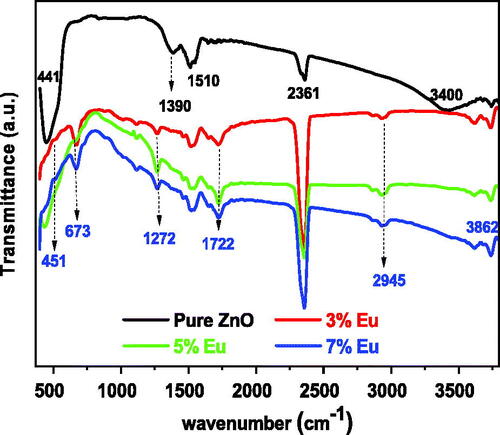
Figure 8. Optical absorption of the undoped and Eu-doped ZnO nanopowders for different Eu concentrations.
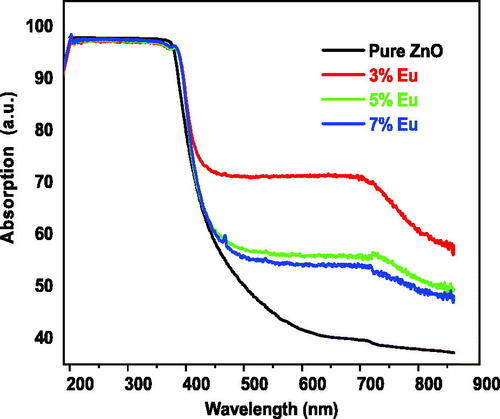
Figure 9. Kubelka-Munk plots of the undoped and Eu-doped ZnO nanopowders for different Eu concentrations.
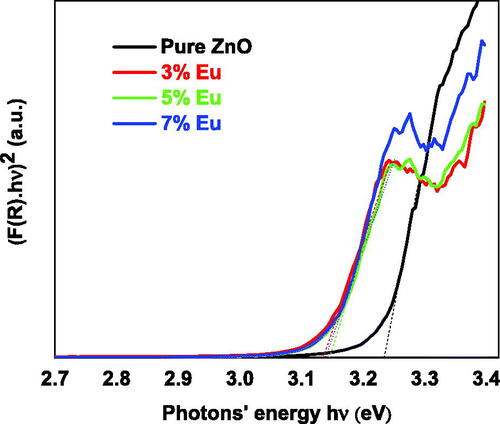
Figure 10. PL spectra for undoped and Eu-doped ZnO samples for various Eu percentages.
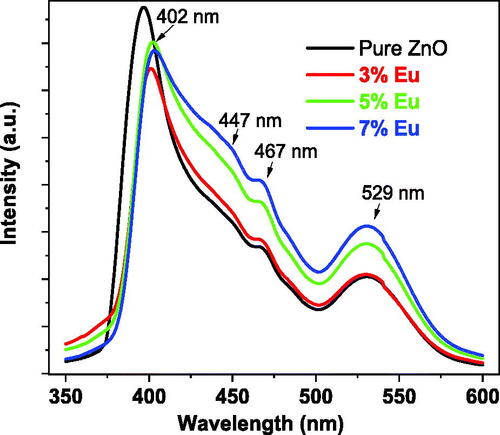
Figure 11. The UV-Vis absorption spectra of MB solution mixed with undoped and Eu-doped ZnO samples.
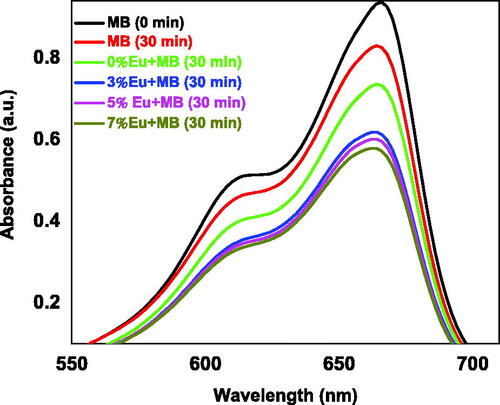
Table 2. The decolorization efficiency of the undoped and Eu-doped ZnO catalysts.
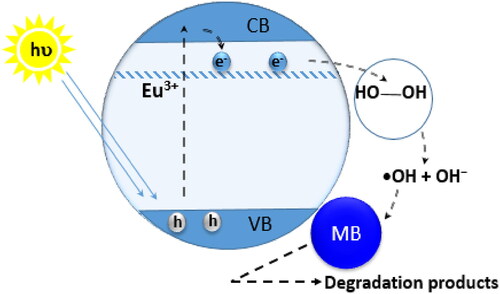
Figure 12. Photocatalytic mechanism for the degradation of MB by Eu-doped ZnO.