
Figures & data
Figure 1. Location of clay and kaolin samples (A) C1, (B) C2, and K (C).
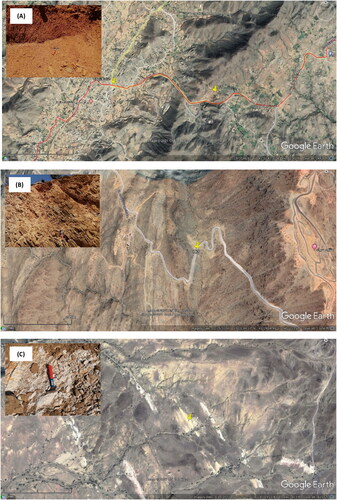
Figure 2. (A) Household water (Wh) and (B) commercial drinking water (Wr).
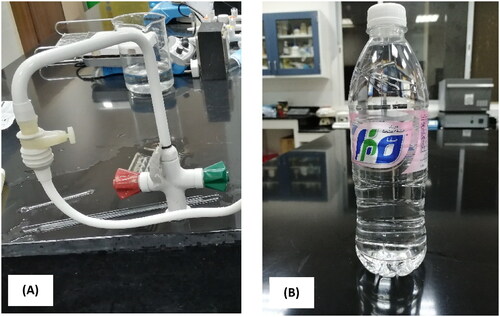
Figure 3. Household water treatment process.
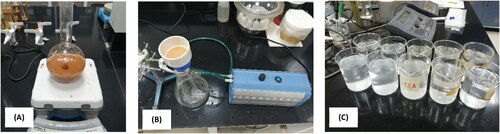
Figure 4. Preparation of the calcined kaolin filter (CKF) for the household water treatment at the point-of-use.
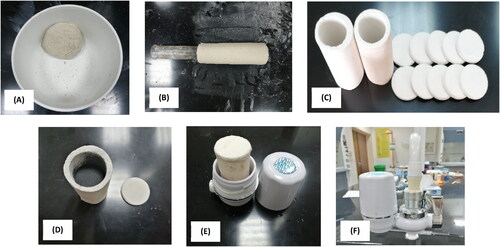
Figure 5. Preparation of the commercial polypropylene filter (PPF) for the household water treatment at the point-of-use.
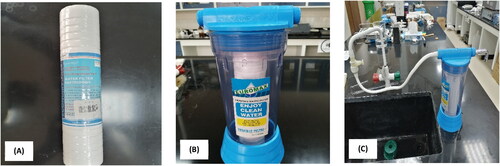
Table 1. XRF analysis of clay and kaolin.
Figure 6. XRD patterns of clay (C1, C2), calcined clay (CC1, CC2), acid treated clay (AC1, AC2), kaolin (K) and calcined kaolin (CK).
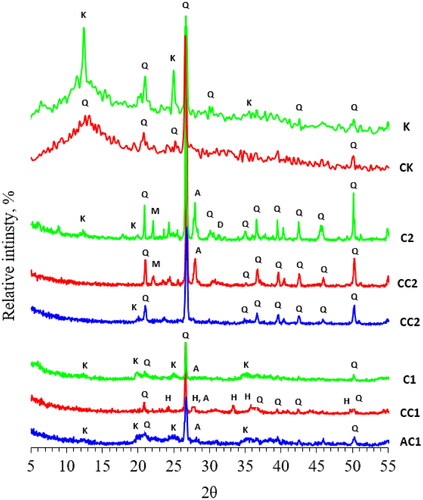
Figure 7. FTIR spectra of clay (C1, C2), calcined clay (CC1, CC2), acid treated clay (AC1, AC2), kaolin (K) and calcined kaolin (CK).
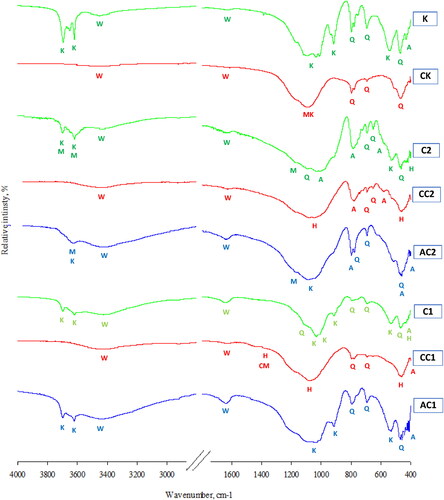
Figure 8. SEM micrographs of clay (C1, C2), calcined clay (CC1, CC2), acid treated clay (AC1, AC2), kaolin (K) and calcined kaolin (CK).
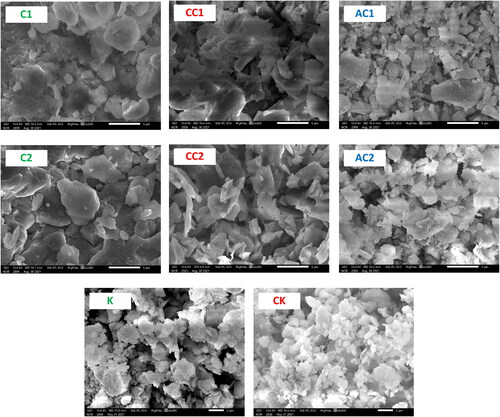
Figure 9. TGA analysis of C1, C2 and K.
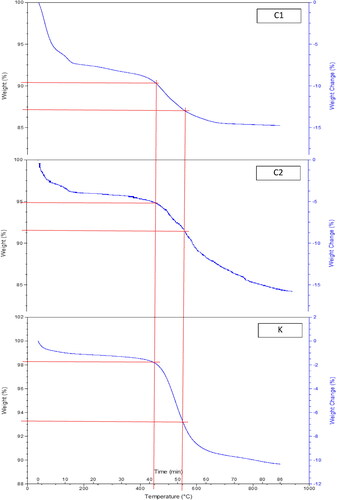
Figure 10. Electrical conductivity and total dissolved solids of raw household water before and after treatment (1–12) as well as after point-of-use treatment by filters (13–14), compared with the drinking water (15).
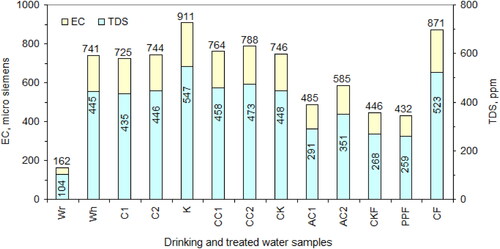
Table 2. The temperature, pH, electrical conductivity, and total dissolved solids of raw household water before and after treatment (1–12) as well as after point-of-use treatment by filters (13–14), compared with the drinking water (15).