
Figures & data
Figure 1. XRD patterns of: (A) xwt% Sr-NT, x = {0, 0.2, 0.4, 0.6, 0.8 and 1.0} and (B) zoom of (101) peak.
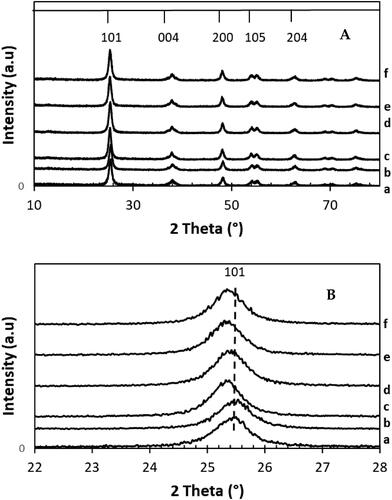
Table 1. Textural and structural properties of x wt% Sr -NT catalysts, x = {0, 0.2, 0.4, 0.6, 0.8 and 1}.
Figure 2. Raman spectra of xwt% Sr-NT with a. 0 wt% Sr, b.0.2 wt% Sr, c. 0.4 wt% Sr, d. 0.6 wt% Sr, e. 0.8 wt% Sr and f. 1.0 wt% Sr.
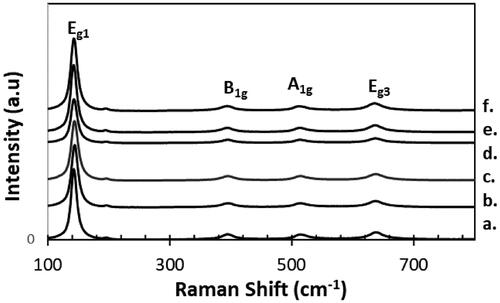
Figure 3. UV-visible spectra (reflectance) of xwt% Sr-NT: a. 0 wt% Sr, b.0.2 wt% Sr, c. 0.4 wt% Sr, d. 0.6 wt% Sr, e. 0.8 wt% Sr and f. 1.0 wt% Sr.
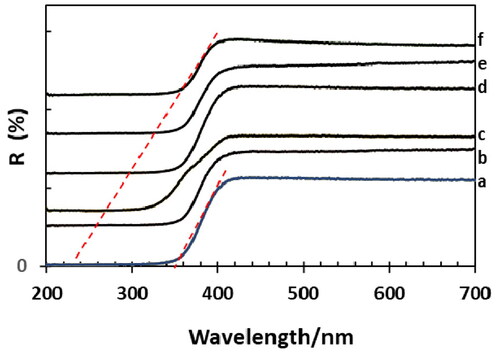
Figure 4. TEM (a) and HR-TEM (b) images of NT, and c. TEM of 0.8 wt% Sr-NT.
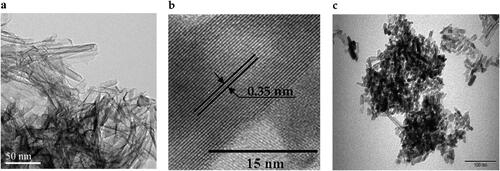
Figure 5. SEM image of (a) 0.8 wt% Sr-NT, and SEM mapping images of (b) O, (c) Sr and (d) Ti.
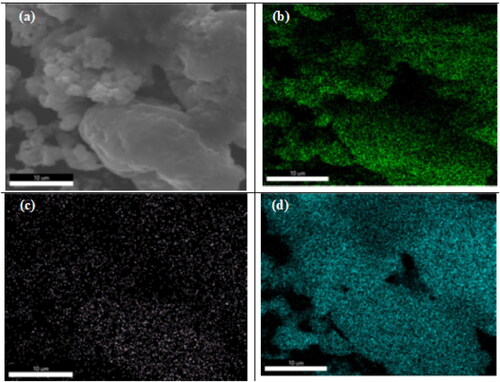
Figure 6. PL signal of a. Sr-free; b. 0.2 wt% Sr and c. 0.8 wt%Sr NT nanomaterials calcined at 400 °C.
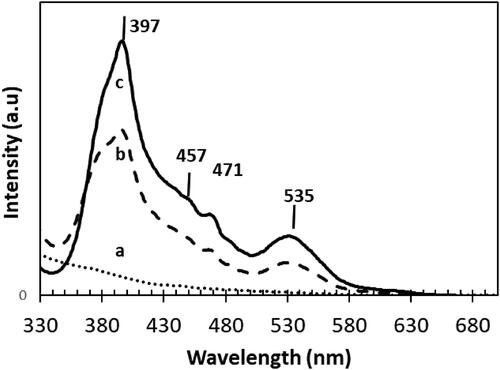
Figure 7. XPS spectra of Sr-free and 0.2 wt% Sr and 0.8 wt%Sr-doped NT nanomaterials calcined at 400 °C: (a) full scan survey of all elements and high-revolution spectra of (b) O 1 s (c) Ti 2p3/2, (d) Sr 3d5/2.
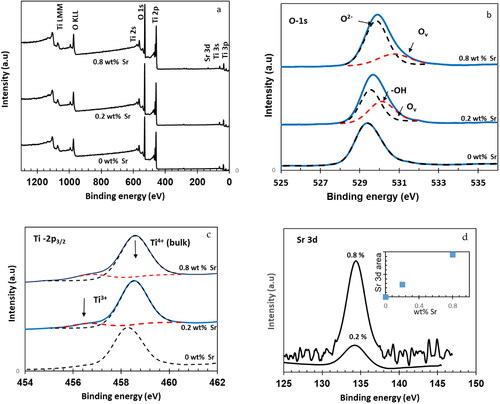
Table 2. XPS results of different xwt% Sr-NT nanomaterials: surface state, binding energy, predominance, molar ratio O2-/Ti4+.
Table 3. Rate constant values (k1 and k2) obtained using pseudo-first order and pseudo-second order models and MB photodegradation.
Figure 8. Kinetic study of MB photodegradation: rate vs equilibrium concentration for a. 0 wt% Sr, b.0.2 wt% Sr, c. 0.4 wt% Sr, d. 0.6 wt% Sr, e. 0.8 wt% Sr and f. 1.0 wt% Sr.
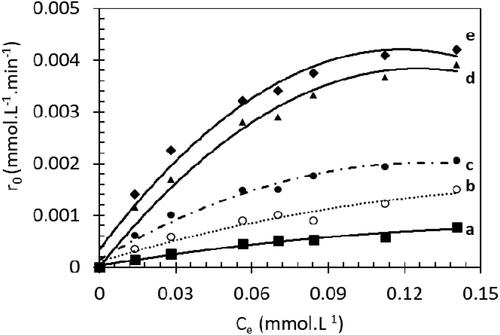
Table 4. Rate constant (kLH), Adsorption constant (KLH) values and surface coverage θ determined using a Langmuir–Hinshelwood model for the Methylene Blue photodegradation.
Figure 9. (a) Variation of C/C0 in the photodegradation of formic acid (FA, 100 mg.L−1) under UV-A light, (b) predominance of Ti species (Ti4+, Ti3+) and oxygen vacancies (Ov).
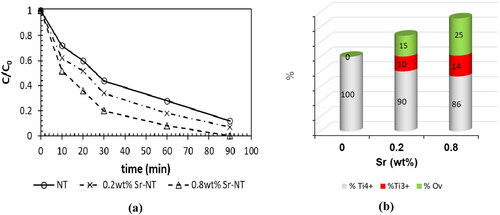
Figure 10. Experimental and theoretical impedance diagrams of the 0.2 wt% Sr-NT and 0.8 wt% Sr-NT (Inset the corresponding equivalent circuit).
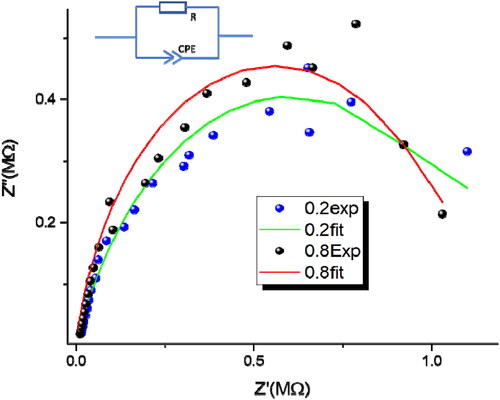
Table 5. Impedance results obtained by fitting the experimental data to the equivalent electrical circuit shown in .