
Figures & data
Figure 1. Plots of pdf of M–L distribution.
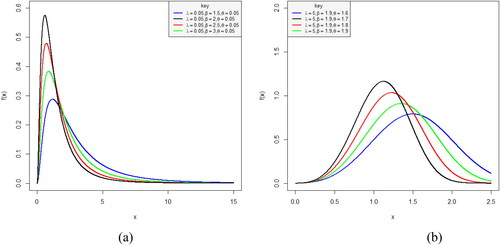
Figure 2. Plots of hazard function of M–L distribution.
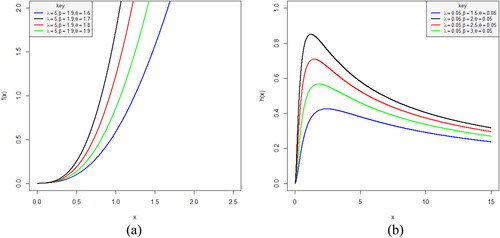
Table 1. Skewness and Kurtosis results of the M–L distribution setting = 0.05 and θ = 0.05.
Table 2. Skewness and Kurtosis results of the M–L distribution setting =5 and θ = 1.6.
Figure 3. Plots of skewness and kurtosis of M–L distribution for different parameter values.
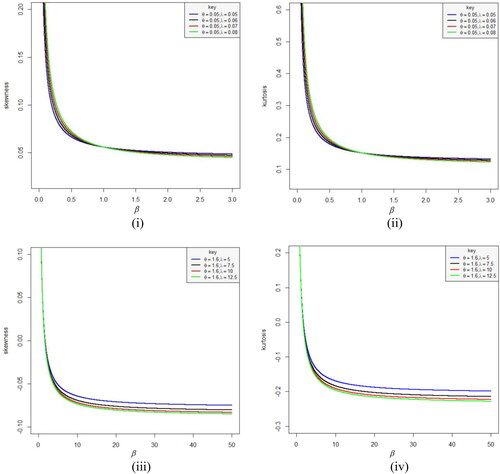
Table 3. Simulation results of the M–L distribution setting and
Table 4. Simulation results of the M–L distribution setting and
Figure 4. TTT plots of dataset 1 (a) dataset 2 (b).
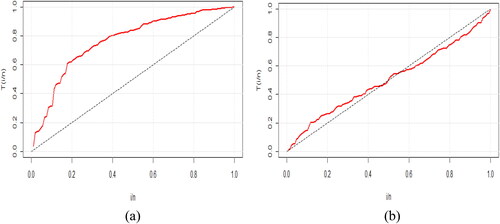
Figure 5. Fitted densities of dataset 1.
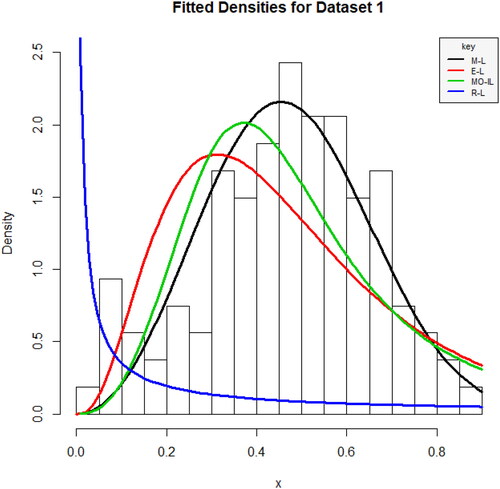
Figure 6. Fitted densities of dataset 2.
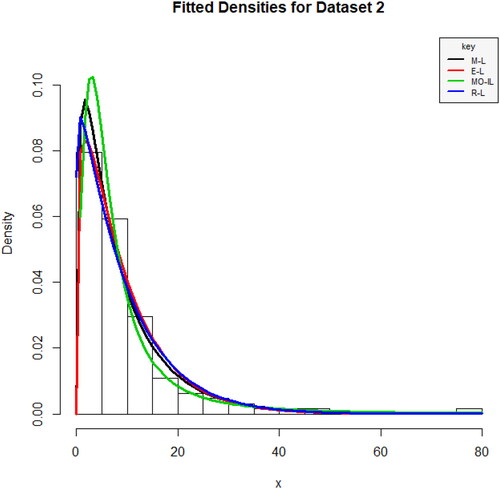
Table 5. MLEs and Goodness-of-fit-statistics for dataset 1.
Table 6. MLEs and goodness-of-fit-statistics for dataset 2.