
Figures & data
Figure 1. Physical geometry of the second grade fluid model.
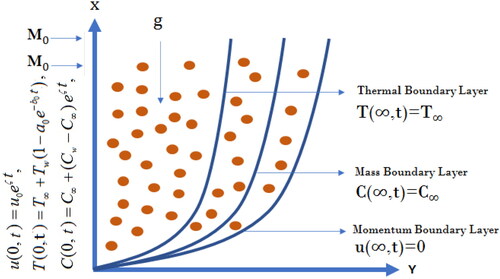
Figure 2. Representation of temperature profile for varying the values of Pr via CF, ABC and CPC.
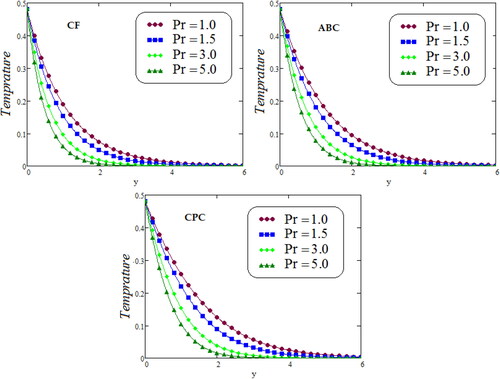
Figure 3. Representation of concentration profile via CF, ABC and CPC for distinct values of Sc.
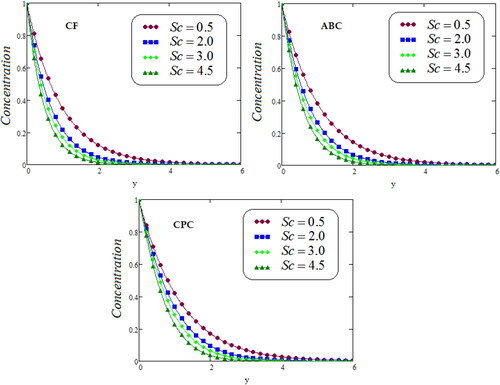
Figure 4. Representation of second grade fluid velocity via CF, ABC and CPC. for distinct values of Gm.
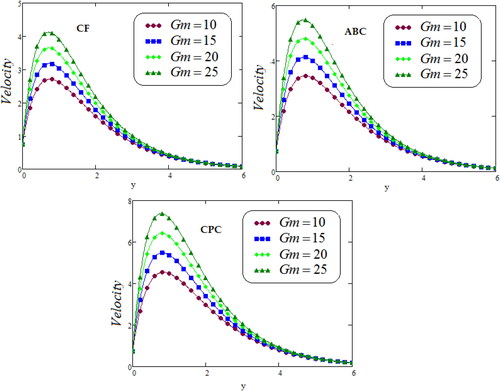
Figure 5. Representation of second grade fluid velocity via CF, ABC and CPC for distinct values of Gr.
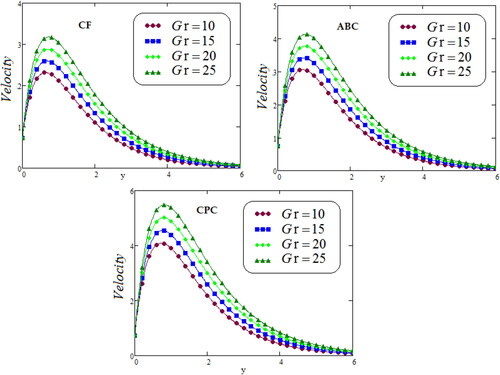
Figure 6. Representation of second grade fluid velocity via CF, ABC and CPC for distinct values of Pr.
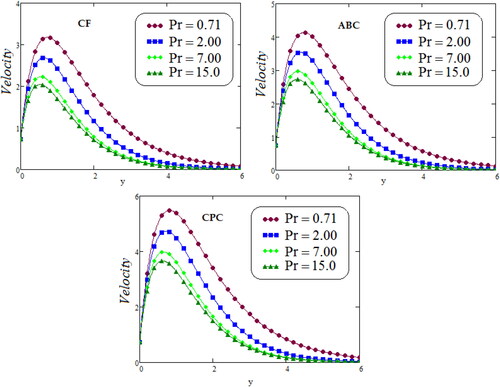
Figure 7. Representation of second grade fluid velocity via CF, ABC and CPC for distinct values of Sc.
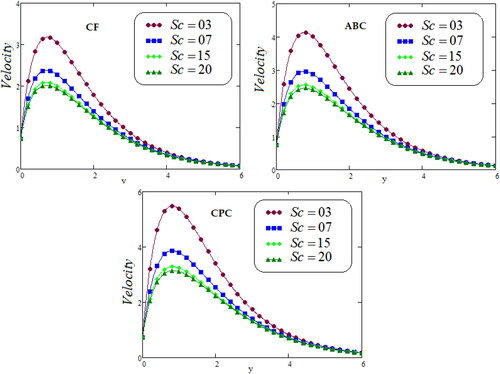
Figure 8. Trace of dimensionless velocity for comparison of CPC, ABC and CF models.
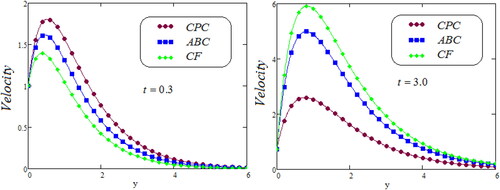
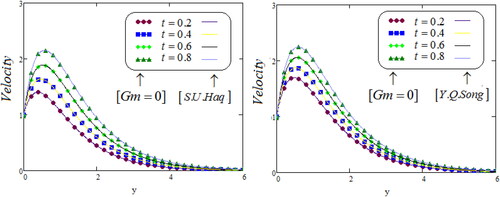
Figure 9. Comparison of the present velocity graphs, taking Gm = 0, with Haq et al. (Citation2021) and Song et al. (Citation2021) velocity graphs.
Data availability statement
The data used in current study, available within the article that support the findings of the present research work.