
Figures & data
Table 1. Bilateral synovial intra-articular recesses and periarticular sites evaluated by ultrasound in bilateral joints.
Table 2. The 86 RA patients’ baseline clinical and laboratory data, and treatment information.
Figure 1. Comparisons of clinical disease activity and US indexes between baseline and 54 weeks in RA patients treated with an anti-TNF agent. At 54 weeks, the patients' swollen joint count (SJC), tender joint count (TJC), patient visual analogue scale (ptVAS), and the mean DAS28-CRP as clinical parameters were significantly decreased compared to their baseline values. As US parameters, the synovial hypertrophy index (SHI) and Doppler synovitis index (DSI) at 54 weeks were significantly decreased compared to baseline. Values are median [25th–75th centiles] or mean (SD), unless otherwise indicated. *p < .05, **p < .005, ***p < .0005, ****p < .0001 for the numerical values at baseline versus 54 weeks by Mann-Whitney U-test.
![Figure 1. Comparisons of clinical disease activity and US indexes between baseline and 54 weeks in RA patients treated with an anti-TNF agent. At 54 weeks, the patients' swollen joint count (SJC), tender joint count (TJC), patient visual analogue scale (ptVAS), and the mean DAS28-CRP as clinical parameters were significantly decreased compared to their baseline values. As US parameters, the synovial hypertrophy index (SHI) and Doppler synovitis index (DSI) at 54 weeks were significantly decreased compared to baseline. Values are median [25th–75th centiles] or mean (SD), unless otherwise indicated. *p < .05, **p < .005, ***p < .0005, ****p < .0001 for the numerical values at baseline versus 54 weeks by Mann-Whitney U-test.](/cms/asset/6cf43a43-7434-4c75-a5c5-dc89efaf1329/timm_a_1531192_f0001_b.jpg)
Figure 2. Correlations between clinical disease activity and US indexes, and the ROC curves of US findings for predicting remission. The relationship of DAS28-CRP and US findings at baseline and 54 weeks. (A,B) The SHI showed a significant correlation with the DAS28-CRP score at baseline and 54 weeks. (C) A weak correlation of the DSI was found with the DAS28-CRP score at baseline. (D) There was no correlation of the DSI with the DAS28-CRP score at 54 weeks. (E) The SHI (i.e., ≤34) and DSI (i.e., ≤7) cut-off point at baseline provided the highest sensitivity and specificity for remission at 54 weeks (SHI; 86.3% and 71.5%, DSI; 77.2% and 48.8%, respectively). **p < .005, ****p < .0001 for the SHI and DSI versus DAS28-CRP by Spearman’s correlation.
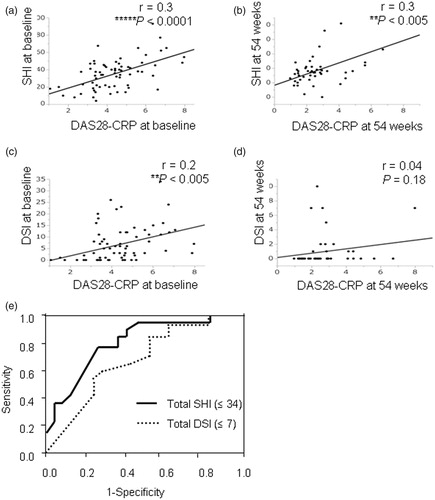
Table 3. Predictors of remission at baseline.
Table 4. Association between remission at 54 weeks and US findings at baseline.