Figures & data
Figure 1. Fate of CD8+ T cells after antigen stimulation. After naïve T cells are activated by the corresponding antigens, they become effector T (TE) cells and die after attack to tumor cells or infected cells. Part of the activated T cells became memory T cells. Memory T cells further differentiated into several subsets after re-stimulation, as follows: stem cell memory (TSCM), central memory T (TCM), effector memory T (TEM) cells, and resident memory T (TRM) cells. TRM stay at local sites to respond immediately to secondary infection. TSCM and TCM cells have a high potential for self-renewal and produce TEM and TE cells after re-stimulation, while killing activity for target cells is high in TEM and TE cells compared with TSCM and TCM cells. TEM, TE, and TRM cells have a limited potential for population expansion, and tend to become terminally differentiated and subsequently die or exhausted (). Genes, markers, and metabolism are listed in this figure, and they are characteristic in early and late memory status.
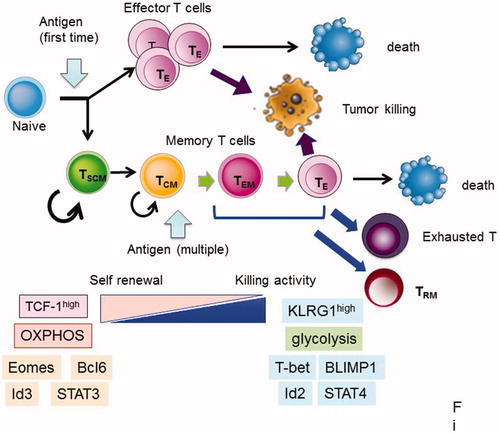
Figure 2. Two types of TIL T cells. Activated tumor infiltrating lymphocytes (TILs) can be divided into two stages: pre-exhausted (or effector) T cells and exhausted T cells. Pre-exhausted T cells respond to checkpoint blockade therapy, while terminally exhausted T cells do not respond to this therapy. Pre-exhausted T cells express higher levels of TCF-1, CXCR5, cytokines including IFNγ, and TNFα, and possess higher killing activity compared with terminally exhausted T cells.
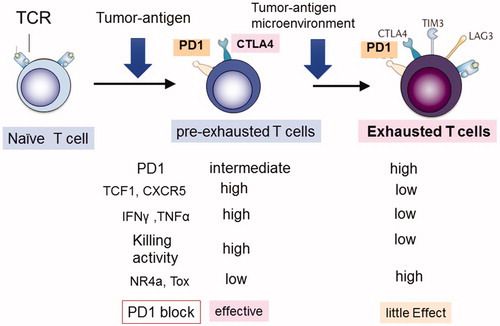
Figure 3. Functions of NR4a factor in Tregs and CTLs (CD8+ T cells). NR4a factors are upregulated by strong or chronic TCR signals in Tregs and CTLs. NR4a factors are essential for Treg development, suppressive functions, maintenance of Foxp3 and Eos expression, and suppression of cytokine expression. While NR4a factors in CTLs induce exhaustion phenotypes including high expression of PD-1 and Tim3, lower expression of cytokines results in lower tumor killing activity.
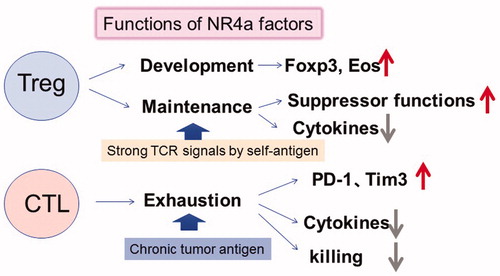
Figure 4. Effect of NR4a factors on PD-1 gene chromatin status and target sequences. (A) The upper two panels show ATAC-seq analysis of the PD-1 gene (pdcd1) in WT and Nr4a-triple KO (TKO) T cells in the tumor. The lower 4 panels show activated T cells in which each NR4a gene or control cDNA (empty) is introduced. The 23 kbp upstream enhancer is shown. (B) The left panels show the comparison of ATAT-seq density between WT and NR4a3-TKO CAR T cells. Concentrated transcription factor binding sites in the region that are differentially activated are shown on the right. Data are from reference [Citation77].
![Figure 4. Effect of NR4a factors on PD-1 gene chromatin status and target sequences. (A) The upper two panels show ATAC-seq analysis of the PD-1 gene (pdcd1) in WT and Nr4a-triple KO (TKO) T cells in the tumor. The lower 4 panels show activated T cells in which each NR4a gene or control cDNA (empty) is introduced. The 23 kbp upstream enhancer is shown. (B) The left panels show the comparison of ATAT-seq density between WT and NR4a3-TKO CAR T cells. Concentrated transcription factor binding sites in the region that are differentially activated are shown on the right. Data are from reference [Citation77].](/cms/asset/596853c1-e4a0-4933-99bc-fdc0e0b90a5f/timm_a_1698261_f0004_c.jpg)
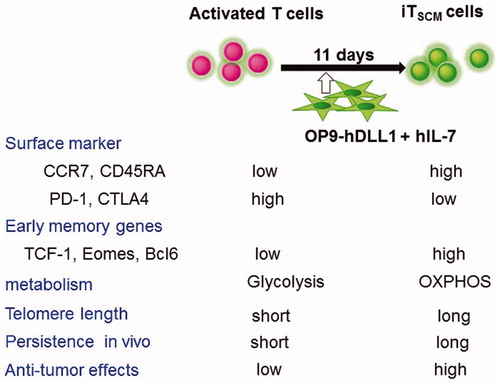
Figure 5. Summary of phenotypes and anti-tumor activity of activated T cells and iTSCM cells. Antigen-specific activated human CD8+ T cells were co-cultured with OP9-hDLL1 cells in the presence of IL-7 for 11 days. Surface markers, memory genes, metabolism, and anti-tumor effects in NOG mice are shown.