Figures & data
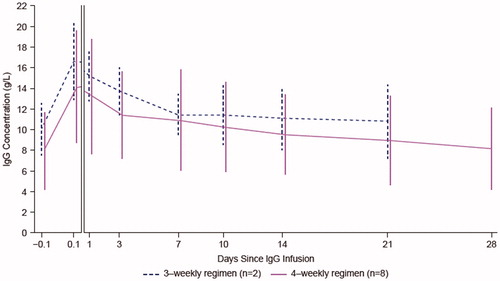
Figure 1. Study overview. aSampling period for 3-weekly dosing regimen: sampling points included −60 minutes to −1 minute prior to infusion, 3–20 minutes post infusion, 24 ± 2 h, 3 ± 1 days, 7 ± 1 days, 10 ± 1 days, 14 ± 1 days, 21 ± 1 days post infusion; bsampling period for 4-weekly dosing regimen: sampling points were the same as for 3-weekly regimena plus 28 ± 2 days post infusion. IgG: immunoglobulin G; PK: pharmacokinetic.
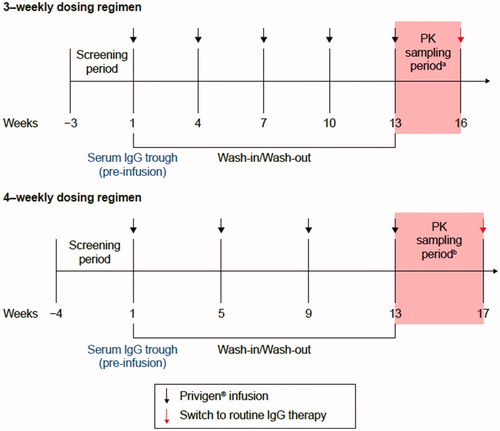
Table 1. Baseline demographic characteristics of patients (PKAS).
Table 2. Serum IgG PK parameters by dosing regimen (PKAS).
Figure 2. Mean (SD) serum IgG concentration-time data by dosing regimen (PKAS). The first two time points (60–1 minutes prior to infusion and 3–20 minutes post infusion) are presented on a different scale. Profiles are shifted for ease of comparison. IgG: immunoglobulin G; PKAS: pharmacokinetic analysis set; SD: standard deviation.