Figures & data
Table 1. Demographic and clinical characteristics of the patients with primary MN.
Figure 1. Stable expression of PLA2R in the HEK293T cells. (A) Flow cytometry showed the expression of PLA2R on the surface of HEK293T cells. The mean fluorescence intensity of PLA2R (red) and of an isotype control (white) are shown. (B) Western blot showed that the PLA2R transfected HEK293T cells expressed the PLA2R transgene between 150 and 250 kD (right lane), while in the mock-transfected cell line (left lane) no positive signal could be detected.
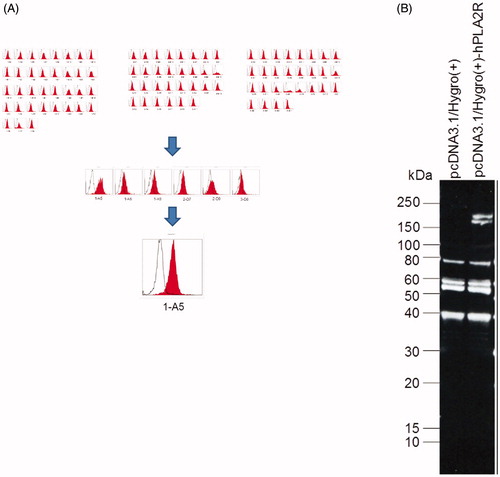
Figure 2. Western blot of anti-PLA2R in the serum of patients with primary MN. By western blot, anti-PLA2R antibodies were detected in 12 out of 23 (52%) patients with primary MN. ‘M’s represent protein molecular weight markers. ‘P’s represent positive controls (i.e., rabbit polyclonal antibodies against human PLA2R).
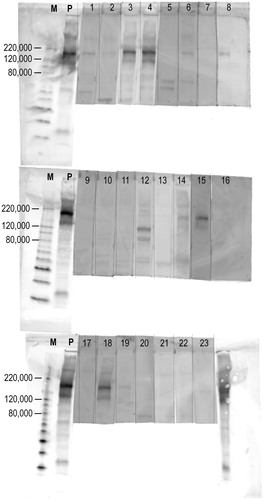
Figure 3. Association between the three measurement methods of anti-PLA2R antibodies. (A) Quantified western blot and cell-based ELISA (Pearson's correlation coefficient, r = 0.94). (B) Quantified western blot and commercial solid-phase ELISA (r = 0.84). (C) Cell-based ELISA and commercial solid-phase ELISA (r = 0.85). (D) The titres of anti-PLA2R antibodies by cell-based ELISAs were significantly higher in western blot-positive samples than those in western blot-negative samples among primary MN patients (p = .048). (E) The titres of anti-PLA2R antibodies by commercial solid-phase ELISAs were significantly higher in western blot-positive samples than those in western blot-negative samples among primary MN patients (p = .015). Correlations were evaluated by Pearson's correlation coefficient. p values were determined by Welch's t-test. Horizontal bars represent mean levels of each group in D and E.
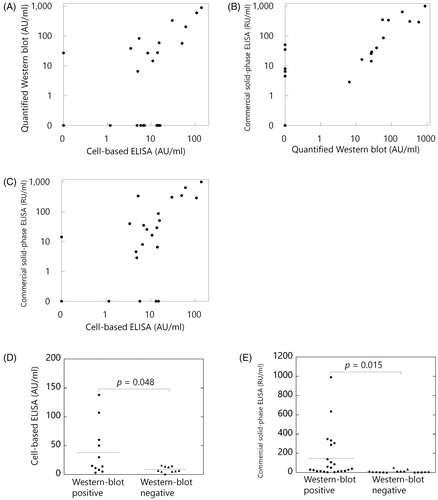
Table 2. Clinical characteristics and the results of anti-PLA2R antibodies in each patient with primary membranous nephropathy.
Table 3. Comparisons of measurement methods about associations between anti-PLA2R antibodies and clinical characteristics among patients with primary MN.
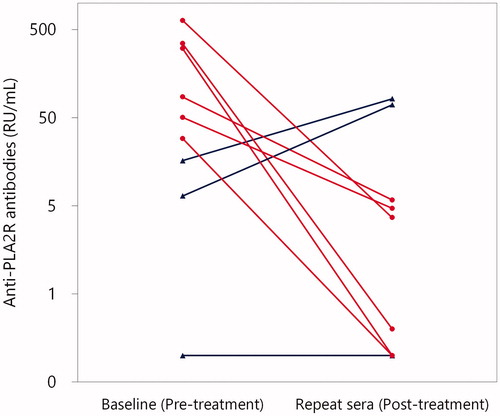
Figure 4. Titres of anti-PLA2R antibodies at baseline and thereafter in patients with primary MN by commercial solid-phase ELISA. Repeat sera were available in nine patients with primary MN. Patients who were treated with and without immunosuppressive treatment were indicated with red circles and blue triangles, respectively. In all of the six patients who were treated with immunosuppressive treatment (red circles), titres of anti-PLA2R antibodies significantly declined (p = .03 by Wilcoxon signed-rank test). By contrast, in two of the three patients in whom immunosuppressive treatment was not administered (blue triangles), the titres of anti-PLA2R antibodies increased.