Figures & data
Figure 1. Highly purified WB-6 cross-reacts with CL-β2GPI and DNA. (A) Reactivity of WB-6 (purified by Protein G) to [CL + β2GPI], [CL + TBS (vehicle for β2GPI)], [Ethanol (vehicle for CL) + β2GPI] was tested by ELISA. (B) Binding activity of WB-6 (purified by Protein G) to [CL + β2GPI] was tested after pre-incubation with ssDNA or dsDNA. (C) After spectrophotometric analysis, the A280/A260 ratio was plotted for conventionally purified C-WB-6 (purified by Protein G), P1-WB-6 (purified with high-salt alkaline wash followed by DNase 1 treatment), and P2-WB-6 (purified with high-salt alkaline wash followed by S1nuclease treatment). (D) Binding activity of highly purified P1-WB-6 (circles) and P2-WB-6 (triangles) to ssDNA (open symbols) and dsDNA (closed symbols). (E) Binding activity of highly purified P1-WB-6 (open circles) and P2-WB-6 (closed circles) to CL-β2GPI.
![Figure 1. Highly purified WB-6 cross-reacts with CL-β2GPI and DNA. (A) Reactivity of WB-6 (purified by Protein G) to [CL + β2GPI], [CL + TBS (vehicle for β2GPI)], [Ethanol (vehicle for CL) + β2GPI] was tested by ELISA. (B) Binding activity of WB-6 (purified by Protein G) to [CL + β2GPI] was tested after pre-incubation with ssDNA or dsDNA. (C) After spectrophotometric analysis, the A280/A260 ratio was plotted for conventionally purified C-WB-6 (purified by Protein G), P1-WB-6 (purified with high-salt alkaline wash followed by DNase 1 treatment), and P2-WB-6 (purified with high-salt alkaline wash followed by S1nuclease treatment). (D) Binding activity of highly purified P1-WB-6 (circles) and P2-WB-6 (triangles) to ssDNA (open symbols) and dsDNA (closed symbols). (E) Binding activity of highly purified P1-WB-6 (open circles) and P2-WB-6 (closed circles) to CL-β2GPI.](/cms/asset/ffdc1bbd-7efb-42d4-979f-4ccb6945c37a/timm_a_1796285_f0001_c.jpg)
Figure 2. Internalization of monoclonal anti-DNA antibodies. (A) PBMCs were cultured with WB-6 (20 µg/ml) for 3 h and imaged by Alexa Fluor 488-labeled anti-mouse IgG after fixation and permeabilization. (B) PBMCs were cultured with 5 µg/ml 2C10, 20 µg/ml WB-6, 0.5 µg/ml H241, or IC IgG for 2, 3, 4 or 5 h, and after fixation and permeabilization, IgG-positive monocytes was estimated by flow cytometry gated on the CD14+ population.
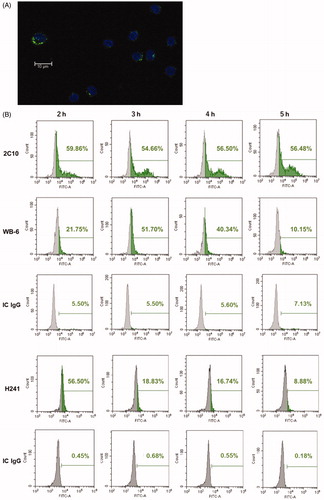
Figure 3. WB-6, but not 2C10 or H241, induces TF expression. PBMCs were incubated for 2-5 h with 5 µg/ml 2C10, 20 µg/ml WB-6 or 20 µg/ml IC IgG and TF expression on monocytes were estimated by flow cytometry (A). PBMCs were incubated for 5 h with 5 or 20 µg/ml WB-6 (B), 2C10 (C) or H241 (D) and TF expression on monocytes were estimated. Each bar shows mean ± SEM of the triplicate assay. *p < .05, **p < .01, ***p < .001.
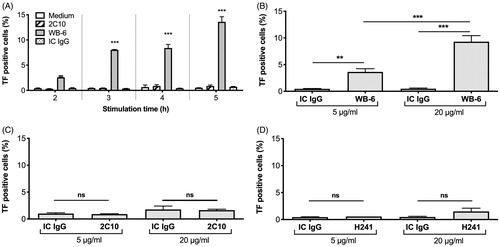
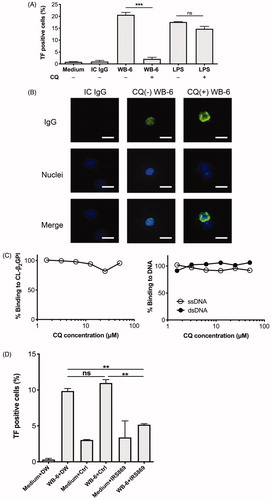
Figure 4. Effect of chloroquine (CQ) and TLR9-inhibitory oligodeoxynucleotide (ODN) on WB-6-induced TF expression. (A) After treatment with 50 µM CQ for 30 min and washing with fresh medium, PBMCs were incubated with 20 µg/ml WB-6, IC IgG, or 100 ng/ml LPS for 5 h and TF-positive monocytes were quantified by flow cytometry. Each bar shows mean ± SEM of the triplicate assay. ***p < .001. (B) Incorporation of IgG by monocytes after incubation as above was estimated by fluorescence microscopy, and representative images are shown. (C) 20 µg/ml WB-6 was pre-incubated for 30 min with the indicated concentrations of CQ, and incubated on ELISA plates coated with CL-β2GPI (left panel), ssDNA or dsDNA (right panel). (D) After treatment with IRS869, control ODN (Ctrl) or distilled water (DW), PBMCs were incubated with 20 µg/ml WB-6 for 5 h and TF-positive monocytes were quantified by flow cytometry. Each bar shows mean ± SEM of the triplicate assay. **p < .01.