Figures & data
Table 1. Relation of P-glycoprotein with disease modifying antirheumatic drugs and immunosuppressants.
Figure 1. Schematic diagram of induction of P-gp expression on B cells and P-gp+ B-cell targeting therapies in RA. (A) YB-1, which is located in the cytoplasm of resting B cells, is translocated by various signal transductions associated with activation of B cells, which results in overexpression of P-gp. (B) P-gp-related treatment resistance in RA can be probably overcome with P-gp+ B-cell targeting therapies as follows; inhibitors of B cell activation and differentiation (JAK inhibitors, TNF antagonists, IL-6 blockade, Anti-CD20 Monoclonal Antibodies), P-gp induction inhibitors (Methotrexate, TNF antagonists, IL-6 blockade, CXCR4 Antagonist), P-gp function inhibitors (P-glycoprotein Competitive Inhibitors) and P-gp+ B-cells depletors (Anti-CD20 Monoclonal Antibodies).
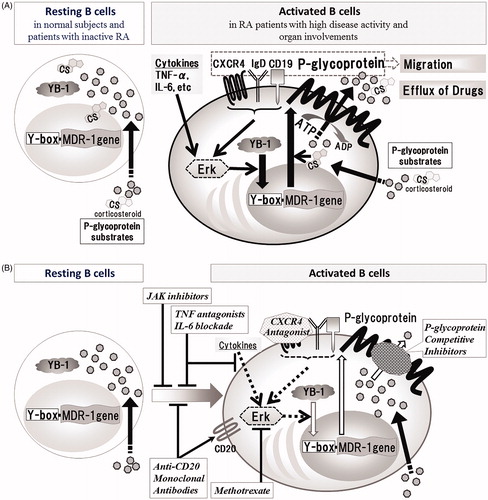
Figure 2. Relations among P-gp+CXCR4+ B cells, P-gp+ CD27-IgD+B cells and RA organ involvement. (A) Correlation between the proportions of P-gp+CXCR4+ B cells and P-gp+ CD27-IgD+B cells in RA patients. Statistical analysis was performed by Person’s correlation analysis. (B) Flow cytometric analysis identified P-gp+ CD27-IgD+B cells in the representative RA patient with rheumatoid vasculitis. Values at the top of each section are percentages of CD19+B cell subpopulations based on CD27/IgD classification. Flow cytometric analysis showed P-gp expression on each B cell subpopulation (blue lines). Data represent the percentages of P-gp-positively stained B cell subpopulations. Red: isotype-control FITC-conjugated anti-mouse IgG Ab. The number of CD27+IgD+CD19+ B cells was lower than that was available for the histogram exhibition and P-gp expression analysis. (C) Flow cytometry for P-gp+ CD27-IgD+B cells in 17 RA patients, including 10 with (closed bar) and 7 without (hatched bar) organ involvement. Values are mean ± SD of independent experiments. *p < .05, by non-paired t-test. RA disease activity, as estimated by the SDAI score, was not significantly different between the two groups (with: 26.5% ± 8.3, without: 30.9% ± 12.9; p = .41). Organ involvement included interstitial pneumonia (n = 2), interstitial pneumonia with rheumatoid vasculitis (n = 3), Felty syndrome (n = 1), amyloidosis (n = 1) and lymphadenopathy (n = 1). (A–C) Specific antibodies used for staining and flow cytometric analysis, including MRK16 for P-gp (a specific mAb against P-gp; Kyowa Medex, Tokyo) with FITC-conjugated goat anti-mouse IgG mAb, cy-chrome-conjugated CD19 mAb, APC-conjugated CD27 mAb and PE-conjugated IgD and CXCR4 mAb (BD Biosciences Pharmingen).
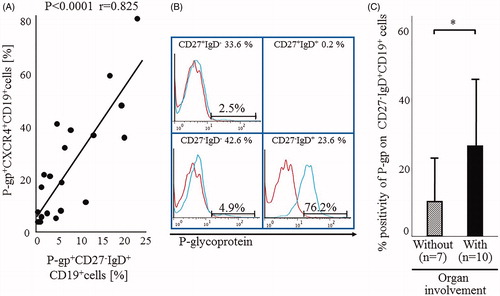
Figure 3. Tacrolimus inhibits excretion of intracellular dexamethasone through P-glycoprotein. 1 × 10⁶ of PBMCs were pre-incubated with (solid circles) or without (open circle) 10 ng/mL of IL-2 for 4 h. Then, 20-min after the addition of [6,7-3H(N)]-dexamethasone and [14C] n-butanol, the cell to medium ratio (C/M ratio; an index of intracellular and extracellular dexamethasone concentration ratio) was evaluated in the presence of the indicated concentrations of tacroliums. The C/M ratio was computed using the following formula: C/M ratio = [(3H in cell fraction/14C in cell fraction)/(3H in medium fraction/14C in medium fraction)]. Data are mean ± SD of five independent experiments. *p < .05, **p < .01, by one-way ANOVA.
![Figure 3. Tacrolimus inhibits excretion of intracellular dexamethasone through P-glycoprotein. 1 × 10⁶ of PBMCs were pre-incubated with (solid circles) or without (open circle) 10 ng/mL of IL-2 for 4 h. Then, 20-min after the addition of [6,7-3H(N)]-dexamethasone and [14C] n-butanol, the cell to medium ratio (C/M ratio; an index of intracellular and extracellular dexamethasone concentration ratio) was evaluated in the presence of the indicated concentrations of tacroliums. The C/M ratio was computed using the following formula: C/M ratio = [(3H in cell fraction/14C in cell fraction)/(3H in medium fraction/14C in medium fraction)]. Data are mean ± SD of five independent experiments. *p < .05, **p < .01, by one-way ANOVA.](/cms/asset/e98f710d-b580-4e3b-8336-0acbc60c5dbb/timm_a_1825276_f0003_b.jpg)
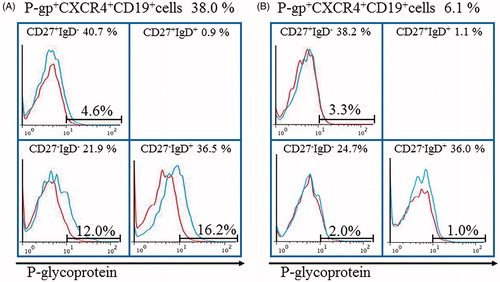
Figure 4. Tocilizumab downregulates P-gp+CXCR4+B cells and P-gp+CD27-IgD+B cells in RA with microscopic polyangiitis. Flow cytometric analysis identified P-gp+CXCR4+B cells and P-gp+CD27-IgD+B cells in the RA patient. Values above the chart are the proportions of P-gp+CXCR4+ B cells just at start (A) and 4 weeks after (B) of tocilizumab therapy. Values at the top of each section are percentages of CD19+B cell subpopulations based on CD27/IgD classification. Flow cytometric analysis showed P-gp expression on each B cell subpopulation (blue lines). Data represent the percentages of P-gp-positively stained B cell subpopulations. Red: isotype-control FITC-conjugated anti-mouse IgG Ab. The number of CD27+IgD+CD19+ B cells was lower than that was available for the histogram exhibition and P-gp expression analysis. Specific antibodies used for staining and flow cytometric analysis, including MRK16 for P-gp (a specific mAb against P-gp; Kyowa Medex, Tokyo) with FITC-conjugated goat anti-mouse IgG mAb, cy-chrome-conjugated CD19 mAb, APC-conjugated CD27 mAb and PE-conjugated IgD and CXCR4 mAb (BD Biosciences Pharmingen).