Figures & data
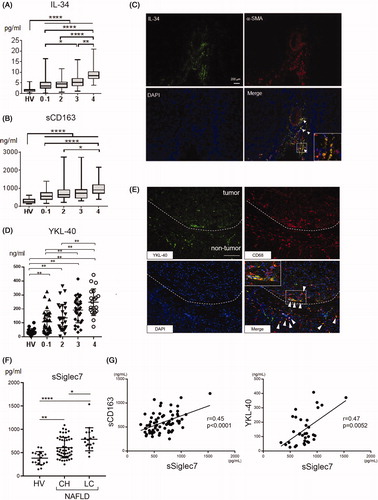
Figure 1. Multifaceted mechanisms in the progression from steatosis to fibrosis/cirrhosis/HCC in non-alcoholic fatty liver disease. The major players involved in the pathogenesis of NAFLD/NASH are shown. The details are described in the text. CAF: cancer-associated fibroblasts; DAMPs: danger-associated molecular patterns; HCC: hepatocellular carcinoma; NAFLD: non-alcoholic fatty liver disease; NASH: non-alcoholic steatohepatitis; PAMPs: pathogen-associated molecular patterns; TAM: tumor-associated macrophage.
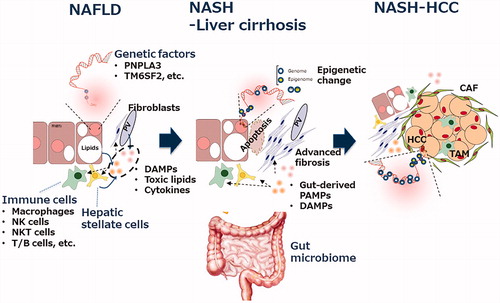
Figure 2. Associations of the serum levels of sCD163, IL-34, YKL40 and sSiglec7 with liver fibrosis in NAFLD patients. A, B) Serum levels of IL-34 (A) and sCD163 (B) in healthy volunteers (n = 20) and biopsy-proven NAFLD patients (n = 197). Horizontal axis: 0–1, 2, 3 and 4 depict the stages of liver fibrosis (F0–1, F2, F3 and F4, respectively). *p≤ .05; **p≤.01; ****p≤.0001 by the Kruskal–Wallis test with Dunn’s multiple comparison test. HV: healthy volunteer. C) Liver tissue was obtained from patients with NAFLD (liver cirrhosis/stage 4). Immunofluorescence staining of frozen liver tissues from patients with NAFLD is shown (×200, green, IL-34; red, α -SMA; blue, DAPI). White arrowheads mark the positions of IL-34- and α-SMA-positive cells. Inset in the photomicrograph shows fluorescent merged cells at an enlarged scale. D) Serum levels of YKL-40 in healthy volunteers (n = 19) and biopsy-proven NAFLD patients (n = 111). Horizontal axis: 0–1, 2, 3 and 4 depict the stages of liver fibrosis (F0–1, F2, F3 and F4, respectively). **p≤ .01 by the Kruskal–Wallis test with Dunn’s multiple comparison test. HV: healthy volunteer. E) Immunofluorescence staining of YKL-40 and CD68 in frozen liver specimens from NAFLD patients with HCC. The dotted line indicates the margin between tumor and non-tumor tissues. White arrowheads mark the positions of YKL-40- and CD68-positive cells. The inset of the photomicrograph shows fluorescent merged cells at an enlarged scale. Scale bar represents 100 μm (×200, green, YKL-40; red, CD68; blue, DAPI). F) Serum levels of sSiglec7 in healthy volunteers (N = 19) and NAFLD patients (n = 93) with chronic hepatitis and liver cirrhosis. Mean ± SD. Horizontal axis: 0–1, 2, 3 and 4 depict the stages of liver fibrosis (F0–1, F2, F3 and F4, respectively). *p<.05; **p<.01; ****p<.0001 by the Kruskal–Wallis test with Dunn’s multiple comparison test. HV: healthy volunteer; CH: chronic hepatitis; LC: liver cirrhosis. G) Correlation of serum sSiglec7 with sCD163 and YKL-40 in NAFLD/NASH patients. Correlations were assessed by Spearman’s analysis.