Figures & data
Figure 1. Macrophages in inflamed synovium differentiate into pathological osteoclasts. Schematic of the differentiation pathway of pathological osteoclasts and AtoMs in arthritis.
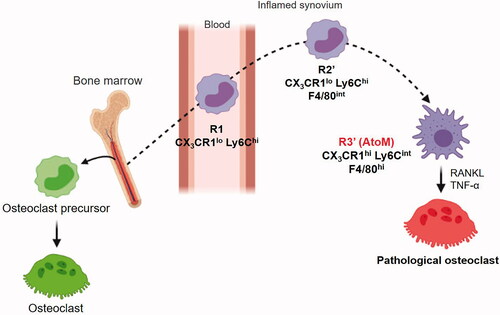
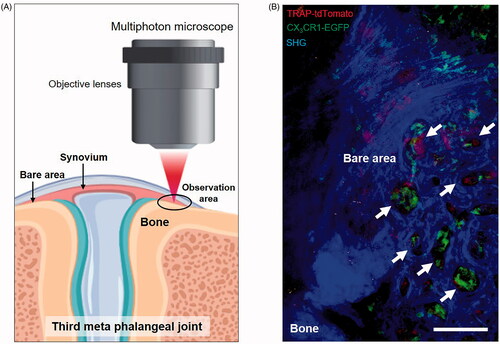
Figure 2. Intravital imaging of pathological osteoclasts in the inflamed synovium. (A) Schematic diagram of multiphoton intravital imaging of the inflamed synovium. (B) An intravital image of the inflamed synovium of a CX3CR1-EGFP/TRAP-tdTomato mouse. Green: AtoMs; Red: pathological osteoclasts; Blue: second harmonic generation (SHG), including the synovium and bones. Arrowheads show representative resorption pits at the pannus–bone interface. Scale bar: 100 µm.