Figures & data
Figure 1. (A) 3 D MIP 18F-FDG PET image in coronal view shows increased uptake in the left axillary lymph nodes (SUVmax, 12.7). In the left deltoid muscle, no increase in FDG uptake was observed. (B) Axial view shows the same finding as the 3 D MIP image.
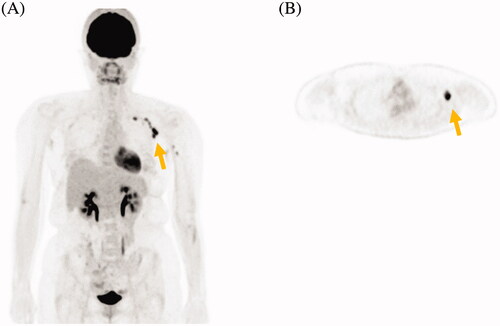
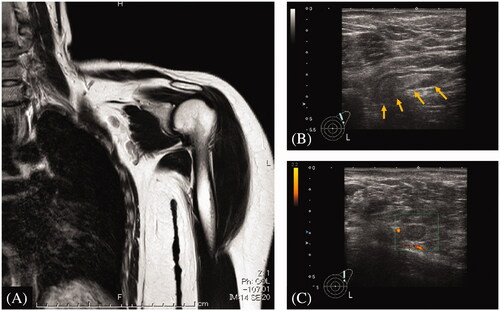
Figure 2. (A) MRI T2-weighted image shows enlarged lymph nodes with normal hilum. (B) The ultrasonographic image shows enlarged lymph nodes (3.5 mm × 9 mm, yellow arrows) with cortical hypertrophy. The nodal hilum was confirmed to be normal. (C) Color doppler image shows normal intranodal and perinodal blood flow.