
Figures & data
Figure 1. Amplified fragments of PD1.3, which were digested by PstI. The first lane is 100 bp DNA marker. The PCR product size was 180 bp. If the product was digested, the allele was identified as A; otherwise, it was identified as G.
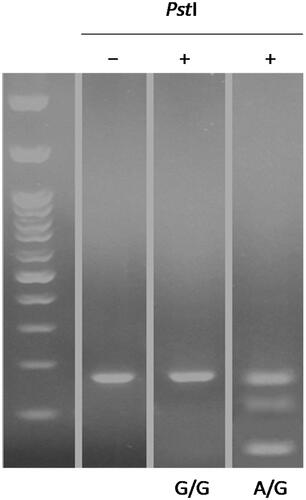
Table 1. Oligonucleotide primers sequences used in PCR-RFLP.
Table 2. Thermal cycling conditions for PCR amplification of PD-1.1, PD-1.3 and PD-1.5 polymorphisms.
Table 3. Comparison of genotypes and alleles from PD-1.1 polymorphism in patient and control groups.
Table 4. Comparison of genotypes and alleles from PD-1.3 polymorphism in patient and control groups.
Table 5. Comparison of genotypes and alleles from PD-1.5 polymorphism in patient and control groups.
Table 6. Frequency of genotypes, alleles and allele carriers of PD-1.5 polymorphism in subjects with different courses of MS disease.