
Figures & data
Figure 1. Cumulative probability plots of radiographic progression assessed by the modified Total Sharp Score (mTSS, U/year). Thirty-four patients (57.6%) showed structural remission (ΔmTSS/year ≤0.5), whereas 7 patients showed clinically relevant radiographic progression (ΔmTSS/year >3).
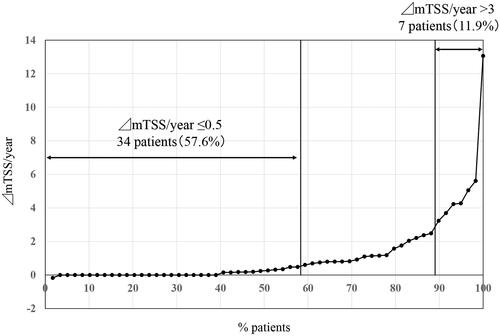
Figure 2. Cumulative probability plots of radiographic progression assessed by the modified Total Sharp Score (mTSS, U/year) sorted by clinical parameters. (A) Sorted by rheumatoid factor (RF) positivity. (B) Sorted by methotrexate (MTX) use. (C) Sorted by prednisolone (PSL) use. (D) Sorted by anti-cyclic citrullinated peptide antibodies (ACPA) positivity. The structural remission rate (ΔmTSS/year ≤0.5) was not affected by RF positivity (p = 1.0), concomitant use of MTX (p = .79), concomitant use of PSL (p = .59), but ACPA-positive patients tended to show higher structural remission rate than ACPA-negative patients (p = .08).
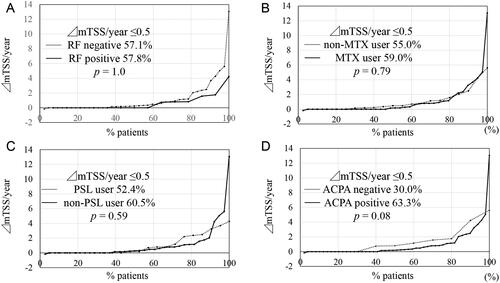
Table 1. Comparison between patients who achieved structural remission and those who did not.
Table 2. Multivariate logistic analysis for long-term structural remission by tocilizumab.
Figure 3. Baseline erythrocyte sedimentation rate (ESR) predicts long-term structural remission by tocilizumab. (A) Receiver operating characteristics (ROC) analysis was performed to determine the cutoff value of baseline ESR. The cutoff value of baseline ESR was determined to be 73 mm/h (area under the curve [AUC]: 0.71, 95%CI: 0.56–0.86, p = .008). (B) The structural remission rate was significantly higher in patients with baseline ESR level <73 mm/h than that in those with a baseline ESR level of ≥73 mm/h (p = .006). Annual progression of erosion (C) and joint space narrowing (D) were both reduced in the lower ESR group than in the higher ESR group (p = .0036, p = .0021, respectively). The data are presented as mean + SD.
![Figure 3. Baseline erythrocyte sedimentation rate (ESR) predicts long-term structural remission by tocilizumab. (A) Receiver operating characteristics (ROC) analysis was performed to determine the cutoff value of baseline ESR. The cutoff value of baseline ESR was determined to be 73 mm/h (area under the curve [AUC]: 0.71, 95%CI: 0.56–0.86, p = .008). (B) The structural remission rate was significantly higher in patients with baseline ESR level <73 mm/h than that in those with a baseline ESR level of ≥73 mm/h (p = .006). Annual progression of erosion (C) and joint space narrowing (D) were both reduced in the lower ESR group than in the higher ESR group (p = .0036, p = .0021, respectively). The data are presented as mean + SD.](/cms/asset/b5bcb36e-729e-44bc-abaf-b12175cdc334/timm_a_2170384_f0003_b.jpg)