
Figures & data
Table 1. Profiles of healthy control subjects and patients with SLE.
Figure 1. DFPP treatment decreases IFN-I-inducing activity and bioavailability. (A) Type I interferon (IFN-I) bioavailability in plasma. IFN-I bioavailability in patients with SLE (n = 11) and healthy control (HC) subjects (n = 5) was quantified using IFN-α/β reporter HEK 293 cells and measuring the optical density (OD) at 620 nm. (B) IFN-I-inducing activity in plasma activity measured in relative light units (RLU). (C) Correlation between IFN-I-inducing activity in the plasma of patients with SLE and SLE disease activity before double filtration plasmapheresis (DFPP) treatment, assessed according to SLEDAI-2K. (D) Correlation between the IFN-I-inducing activity reduction ratio and SLE disease activity. The ratio of IFN-I-inducing activity reduction was calculated by dividing the value after DFPP by the value before DFPP treatment. (E) Correlation between IFN-I-inducing activity and bioavailability in the plasma of SLE patients before undergoing DFPP treatment. Each symbol represents an individual. Differences between the groups were evaluated using the Wilcoxon signed-rank test (A,B). Two asterisks (**) indicate p < .01. The associations between two variables were assessed using Spearman’s correlation (C,D) and Pearson’s correlation (E).
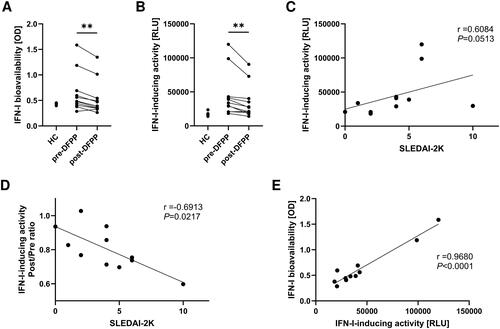
Figure 2. IFN-I-inducing activity was reduced by the IFN-I blocking cocktail and further reduced by DFPP treatment. (A) Type I interferon (IFN-I)-inducing activity in plasma with or without an IFN blocking cocktail. IFN-I-inducing activity in patients with SLE (n = 11) and healthy control (HC) subjects (n = 5) was quantified by using THP-1 dual macrophages incubated with or without an IFN-I blocking cocktail and measuring relative light units (RLU) of chemiluminescence. Plasma samples from SLE patients were collected pre- and post-double-filtration plasmapheresis (DFPP) treatment. The IFN-I blocking cocktail contained 1 μg/mL each of anti-human IFN-α2, anti-human IFN-β antibodies, and anti-IFN-α/β receptor chain 2 antibodies. (B) IFN-I-inducing activity in plasma with an IFN-I blocking cocktail. Each symbol represents an individual. Differences between the groups were evaluated using the Wilcoxon signed-rank test (A,B). Two asterisks (**) indicate p < .01, and three asterisks (***) denote p < .001.
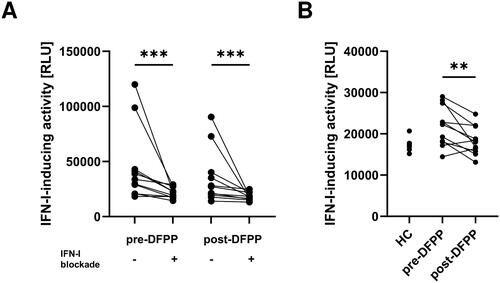
Figure 3. Reduction of IFN-I-inducing activity was not observed in STING-knockout reporter cells. (A) Type I interferon (IFN-I)-inducing activity in plasma of patients with SLE (n = 11) and HCs (n = 5), quantified using THP1-Dual-KO-STING cells differentiated into macrophages and measuring relative light units (RLU) of chemiluminescence. Plasma samples from SLE patients were collected pre- and post-double-filtration plasmapheresis (DFPP) treatment. (B) Concentration of plasma double-stranded DNA (dsDNA). (C) Correlation between the reduction in IFN-I-inducing activity and plasma dsDNA removal rate. Each symbol represents an individual. The overall differences between the groups were evaluated using the Wilcoxon signed-rank test (A,B). Three asterisks (***) indicate p < .001. Associations between the two variables were assessed using Pearson’s correlation coefficient (C).
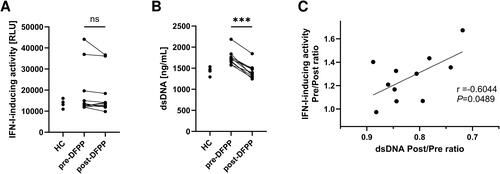
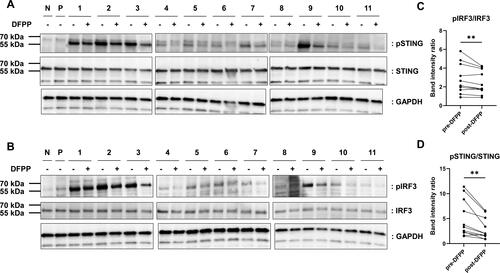
Figure 4. DFPP treatment reduced STING and IRF3 phosphorylation. Extracts were prepared from THP-1 macrophages stimulated with either RPMI1640 alone (N), 1 μg/mL of 2′-3′-cyclic GMP-AMP (P), or plasma from patients with SLE (1–11) and subjected to western blotting analysis. Plasma samples from SLE patients were pre- and post-double-filtration plasmapheresis (DFPP) treatment. (A,B) Fold-change in the protein levels of stimulators of interferon genes (STING) and phosphorylated STING (pSTING) levels (A) and interferon regulatory factor (IRF3) and phosphorylated IRF3 (pIRF3) levels (B). Glyceraldehyde-3-phosphate dehydrogenase (GAPDH) was used as a loading control for protein normalisation. (C,D) pSTING (C) and pIRF3 (D) band intensity comparisons were conducted with normalisation against STING and IRF band intensities, respectively. Each symbol represents an individual. The overall differences between the groups were evaluated using the Wilcoxon signed-rank test (C,D). Two asterisks (**) indicate p < .01.
Supplemental Material
Download Zip (4.2 MB)Data availability statement
The data underlying this article will be shared, upon reasonable request, with the corresponding author.