
Figures & data
Table 1 Demographic and clinical characteristics of participants at baselineTable Footnotea
Figure 1 Mean BMD over time by study group and anatomic site. Note: The sample size varied slightly across time points, with 27, 24 and 23 participants at baseline, week 24 and week 48 respectively. Thus, there may be small discrepancies between the BMD trend exhibited in the figure and the mean changes shown in , which was computed based on participants with both baseline and follow-up data.
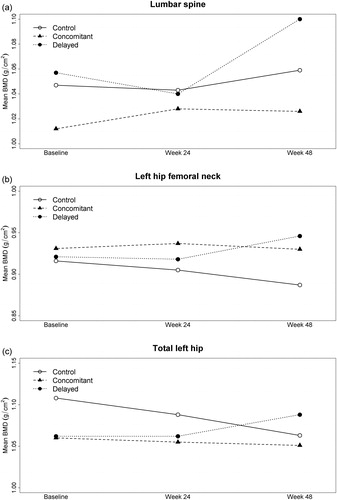
Table 2 Baseline mean (SD) BMD values and mean (SD) change from baseline in BMD at 24 and 48 weeks, by study armTable Footnotea
Table 3 Linear mixed regression results showing differences in BMD at weeks 24 and 48 between study arms
Table 4 Estimated sample size requirements for a 1:1 randomized controlled trial of alendronate/vitamin D during antiretroviral initiation (for α = 0.05 and 80% power)