
Figures & data
Figure 1 Flow diagram of PLWH selection for participation in the aerobic training program. *Co-infection with hepatitis C virus (n = 86), hepatitis B virus (n = 7), diagnosed with psychological disorders (n = 6), cardiac abnormalities (n = 6), absence of ARV adherence (n = 6), human T-lymphotropic virus (n = 5), motor changes (n = 5), pregnancy (n = 3), Chagas disease (n = 2), cognitive impairment (n = 2), severe anemia (n = 2) illicit drug use (n = 1),visually impaired (n = 1) and 30 people living with HIV had 2 or more of these associated changes. #Abandoned training (n = 4), muscle injures (n = 2), cancer diagnosis (n = 1) and drug treatment failure (n = 1).
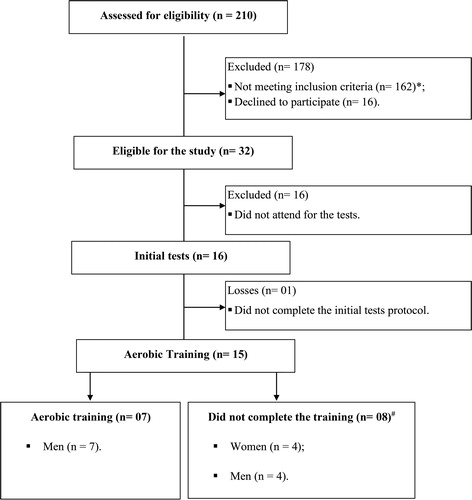
Figure 2 Effects of aerobic training on heart rate variability in PLWH. (A) SDNN: standard deviation of normal sinus rhythm pulse intervals/ms; (B) RMSSD: root mean square of the successive differences/ms; (C) LF: low frequency; (D) HF: high frequency; (E) LF:HF ratio. Diamonds represent the average values. Circles and squares represent individual data before and after for aerobic training. Wilcoxon matched-pairs signed rank test was applied to compare baseline and post values. Statistical significance was defined as p ≤ 0.05.
