Figures & data
Table 1 Prevalence of COVID-19 symptoms since the U.S. outbreak started, by HIV serostatus^ (administered April–June 2020 and representing past ∼4 months) in the MWCCS
Table 2 Cumulative prevalence of SARS-CoV-2 infection via PCR-based testing at time of survey completion (April–June 2020), by HIV status^ among MWCCS participants
Table 3 Reasons not tested for SARS-CoV-2 infection among those not tested by HIV serostatus^
Table 4 Predictors of SARS-CoV-2 positivity (PCR-based test) among 433 MWCCS participants tested at the time of this survey April–June 2020
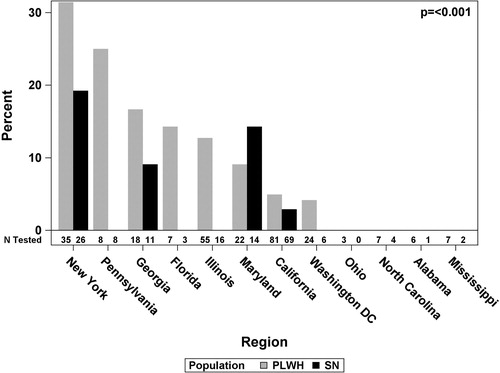
Figure 1 Prevalence of SARS-CoV-2 positivity among MWCCS participants tested by study site and HIV serostatus∼
∼Number tested at each site is shown below each bars, by HIV status. There were 41 SARS-CoV-2 positive cases, this included 16 cases in New York (11 PLWH and 5 SN), 2 PLWH cases in Pennsylvania, 4 cases in Georgia (3 PLWH and 1 SN), 1 PLWH case in Florida, 7 PLWH cases in Illinois, 4 cases in Maryland (2 PLWH and 2 SN), 6 cases in California (4 PLWH and 2 SN), and 1 PLWH case in Washington DC. Fischer’s Exact test was used for the p-value for the difference in percent positive by site.