Figures & data
Table 1 Demographic and clinical characteristics at time of entry to UK CHIC of the heterosexual women included in the study, overall and stratified by age group at study entry
Table 2 Follow-up time (person-years) contributed by women included in the study with different demographic and clinical characteristics, overall and percentage stratified by age group
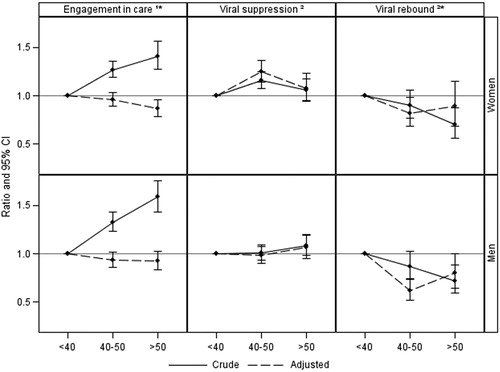
Figure 1 Crude and adjusted odds/hazard ratio of engagement in care*, time to viral suppression and viral rebound* at peri- and post-menopausal age compared to pre-menopausal age. Adjusted for ethnicity, ever started cART, previous AIDS, HBV/HCV, calendar year, CD4+ T-cell count, HIV viral load. CI, confidence intervals; 1logistic regression; 2Cox proportional hazard model; * time-updated covariates.