
Figures & data
Figure 1 Patients distribution.
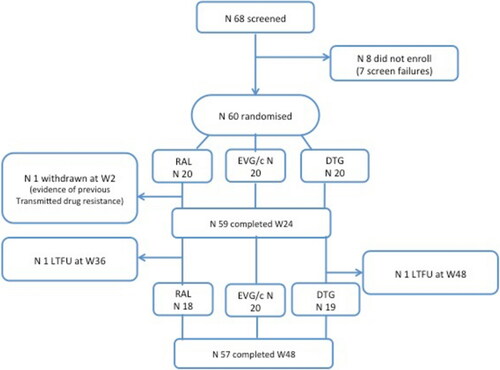
Table 1 Baseline characteristics
Figure 2 Changes in urinary RBP/Creatinine from baseline.
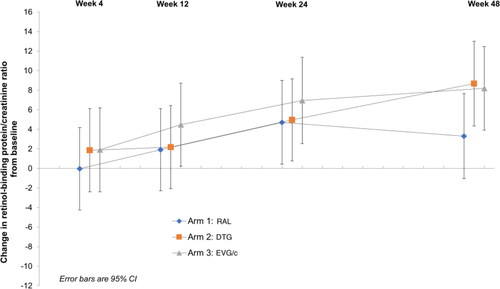
Table 2 Urinary changes in tubular markers from baseline at W12, W24 and W48
Figure 3 Estimates of glomerular filtration with C-G, MDRD, CKD-EPI (creatinine) and CKD – EPI (creatinine and cystatin) at week 12, 24 and 48.
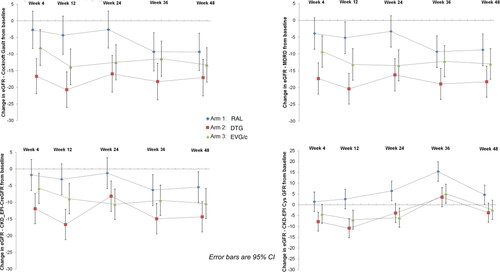
Figure 4 Change in weight.
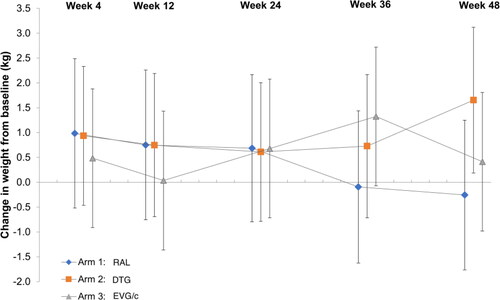
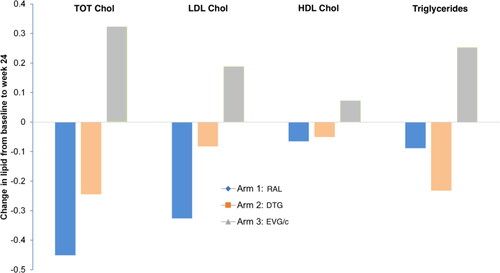
Figure 5 Changes in lipids at week 24.
Supplemental material