Figures & data
Figure 1. Flow diagram of the study. HIV; Human Immunodeficiency Virus.
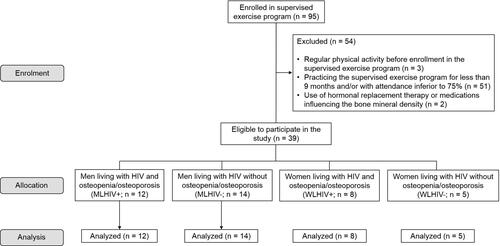
Table 1. Baseline clinical characteristics and body composition in PLHIV with osteopenia/osteoporosis (MLHIV + and WLHIV+) and without osteopenia/osteoporosis (MLHIV − and WLHIV−) (n = 39).
Figure 2. Individual and mean data depicting the change from baseline (Δ) for bone mineral density for the whole body (A), femoral neck (B), total femur (C), and lumbar spine (D) of men with (MLHIV+) and without osteopenia/osteoporosis (MLHIV−). *p < 0.05.
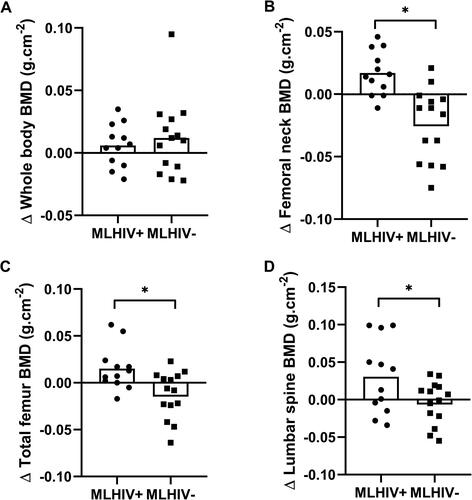
Figure 3. Individual and mean data depicting the changes from baseline (Δ) for bone mineral density for the whole body (A), femoral neck (B), total femur (C), and lumbar spine (D) of women with (WLHIV+) and without osteopenia/osteoporosis (WLHIV−). *p < 0.05.
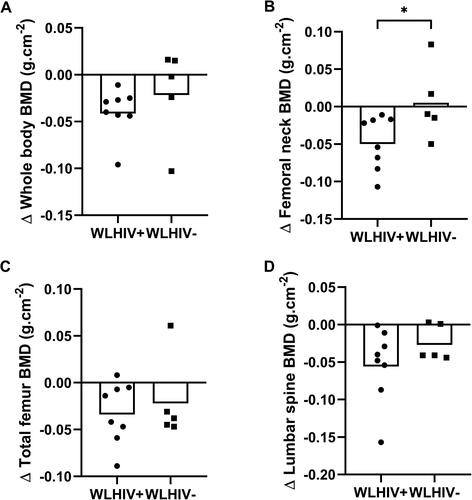
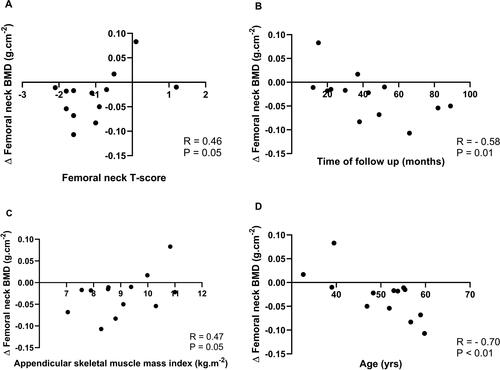
Figure 4. Correlations between changes from baseline (Δ) for bone mineral density in femoral neck and baseline femoral neck T-score (A), time of follow-up (B), appendicular skeletal muscle mass index (C), and age (D) in men living with HIV.
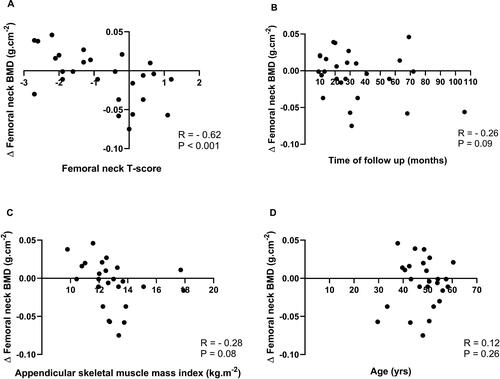
Figure 5. Correlations between changes from baseline (Δ) for bone mineral density in femoral neck and baseline femoral neck T-score (A), time of follow-up (B), appendicular skeletal muscle mass index (C), and age (D) in women living with HIV.